View the new GIS Story Map. It showcases DelDOT’s Bicycle LTS model that provides a basis to plan for a bicycle-friendly Delaware. Low-stress bicycle networks should produce a comfortable experience for bicyclists, of all ages and abilities, through a connected system of low-speed local roads, off-street trails, and on-street bicycle facilities. Bicycle Level of Traffic Stress (LTS) refers to the idea that a set of criteria and measures of low-stress connectivity can be used to evaluate and guide bicycle network planning. The Delaware Department of Transportation (DelDOT) has developed a Bicycle LTS model, available on First Map, the State of Delaware’s GIS portal, to help visualize and plan for a bicycle-friendly Delaware. This GIS Story Map showcases the Bicycle LTS Model, highlights ways to assess bicycle LTS in a community, and can be used as a basis to plan for a bicycle-friendly Delaware.
Tag Archives: gis
Delaware Complete Communities 2018 Year in Review Story Map
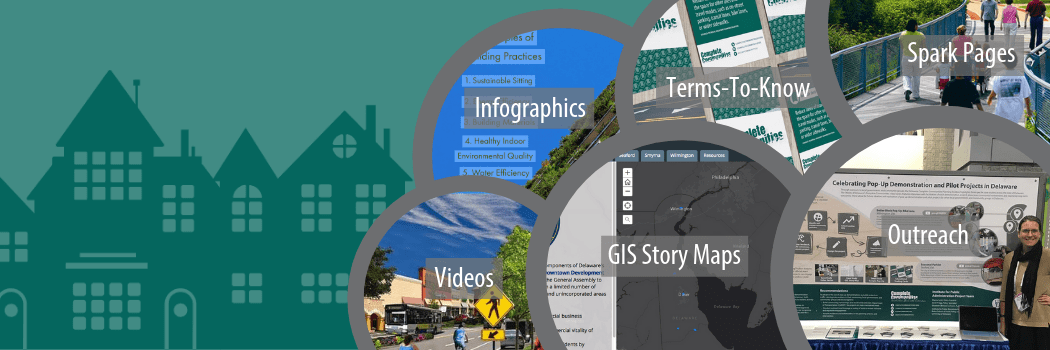
The Delaware Complete Communities Planning Toolbox project strives to provide local government officials, planning commission members, and “citizen planners” with the tools they need to create communities that are accessible, economically vibrant, healthy, inclusive, resilient, and livable for all residents. The Delaware Complete Communities 2018 GIS story map highlights initiatives undertaken in 2018 to support, develop, promote, and maintain the Delaware Complete Communities Planning Toolbox.
New Toolbox content, in the form of web pages, GIS Story Maps, Adobe Spark pages, videos, and infographics, is designed to foster an understanding of strategies to plan and design for complete communities in Delaware. New topics developed for the Toolbox with high-impact visual content are organized by the five elements of a complete community. Virtually meet the Delaware Complete Communities project team, view the project timeline, learn about the geography of our work, and experience the interactive content developed over the past year!
Stories of Delaware’s Complete Communities
Explore the Stories of Delaware’s Complete Communities GIS story map to learn how communities are creating pop-ups for calmer traffic and resident engagement. Reconfiguring roadways and public spaces can help calm traffic and achieve more walkable-, bikeable-, and activity-oriented places. But, permanent, large-scale changes can be difficult to launch. Each of the stories featured in this story map demonstrates how communities can come together to creatively address problems through temporary, low-cost pop-up projects, which can enhance public spaces and inspire more permanent change.
Often described as “tactical urbanism,” pop-up demonstration and pilot projects, like those featured in this story map, are designed to provide low-cost, temporary built-environment changes that are guided by community goals and work to transform public spaces into vibrant, activity-oriented destinations with calm traffic. View this GIS story map to learn how tactical urbanism in Delaware has been used to test a pop-up bike lane and transform a street to a vibrant cultural corridor, calm traffic with a temporary traffic circle, and convert on-street parking into a portable parklet.
Esri Featured Story Maps

According to Esri, the gallery “a selection of stories we’ve hand-picked to highlight particular subjects, best practices and approaches.” Click on the image to visit the gallery.
The Complete Communities Story Map Gallery is featured by Esri, an international GIS company. Known as the global leader in GIS software, Esri provides ArcGIS, a software that can be used to assess and present data in a spatial context. Using ArcGIS, Complete Communities creates story maps, which are visually engaging platforms that allow spatial data and information to be presented in a multimedia, storytelling format.
IPA Presents Public Involvement Poster at 96th Annual TRB Meeting

Savannah Edwards and Marcia Scott present at the Transportation Research Board
IPA Policy Scientist Marcia Scott and Public Administration fellow Savannah Edwards (MPA ’17) presented a poster at the 96th Annual Meeting of the Transportation Research Board (TRB) in Washington, D.C. on January 9 and 10, 2017. TRB Session 697, “Current Issues in Transportation Public Involvement.” The poster, entitled “GIS Story Maps Empower and Engage Stakeholders in Planning for Complete Communities in Delaware,” was among the 25 selected for presentation by the TRB Committee on Public Involvement. The poster graphically displays how GIS Story Maps can engage planning stakeholders via both conventional, in-person methods (e.g., public meetings and workshops), and newer, high-tech strategies (e.g., accessing Apps from computers and mobile devices).
Designed by IPA Policy Specialist Sarah Pragg, the 4’ x 8’ poster summarizes research, funded by the Mid-Atlantic Transportation Sustainability University Transportation Center (MATS UTC), which explores the use of GIS Story Maps to satisfy mandates for increased transparency, accountability, and public engagement in planning for transportation-efficient and sustainable places. The final report, GIS Story Maps: A Tool to Empower and Engage Stakeholders in Planning Sustainable Places, is available electronically on IPA’s transportation policy publications webpage.
IPA has developed a series of GIS Story Maps to illustrate Delaware’s complete communities planning framework that is designed to build capacity of local governments to create “attractive, inclusive, efficient, healthy & resilient places.” Each Story Map conveys one of the five elements of a complete community. IPA’s poster is on display on the first floor or University of Delaware’s Graham Hall. IPA’s GIS Story Map Gallery can be viewed online at http://arcg.is/25DcjGV.
GIS Story Map “Reimagines” Laurel
This GIS Story Map was developed for the Town of Laurel to highlight its outstanding redevelopment potential, location for small businesses, and quality of life. The GIS Story Map offers a variety of demographic and marketing data, points of interest, marketing research, and information about infrastructure and rates.
The story map is a project of the Sussex County Economic Development Action Committee (SEDAC), funded by the University of Delaware’s Sustainable Coastal Communities program. The maps and data are easy to upgrade and link to or embed on a town’s website. The map series was constructed by Nicole Minni, GISP, of the University of Delaware IPA and Lee Ann Walling, AICP, of Cedar Creek Sustainable Planners.
Visit the story maps section of the toolbox to learn more about how you can use this tool to promote local government initiatives to support market-ready (re)development in your community.
Contact IPA’s GIS Specialist Nicole Minni, at nminni@udel.edu, to obtain information on contracting her services to develop story maps.
The Benefits of GIS Story Maps
Story maps serve as a great visualization tool for communicating a story or sequential events through the use of photos, videos, and geospatial data; summarizing each step for managers, decision makers and the general public.
The new story maps section of the toolbox highlights two story maps in Delaware that promote local government initiatives to support market-ready (re)development.
Contact IPA’s GIS Specialist Nicole Minni, at nminni@udel.edu, to obtain information on contracting her services to develop story maps.