Infographics are visual presentations of information that use the elements of design to display content. They are ideal to quickly, precisely, and clearly convey a complex planning topic. While an infographic may provide a self-contained message or principle, more in-depth information on the topic may be obtained from the Delaware Complete Communities Planning Toolbox.
Infographics Gallery
Click or tap on the graphics below for a larger view, available to download.
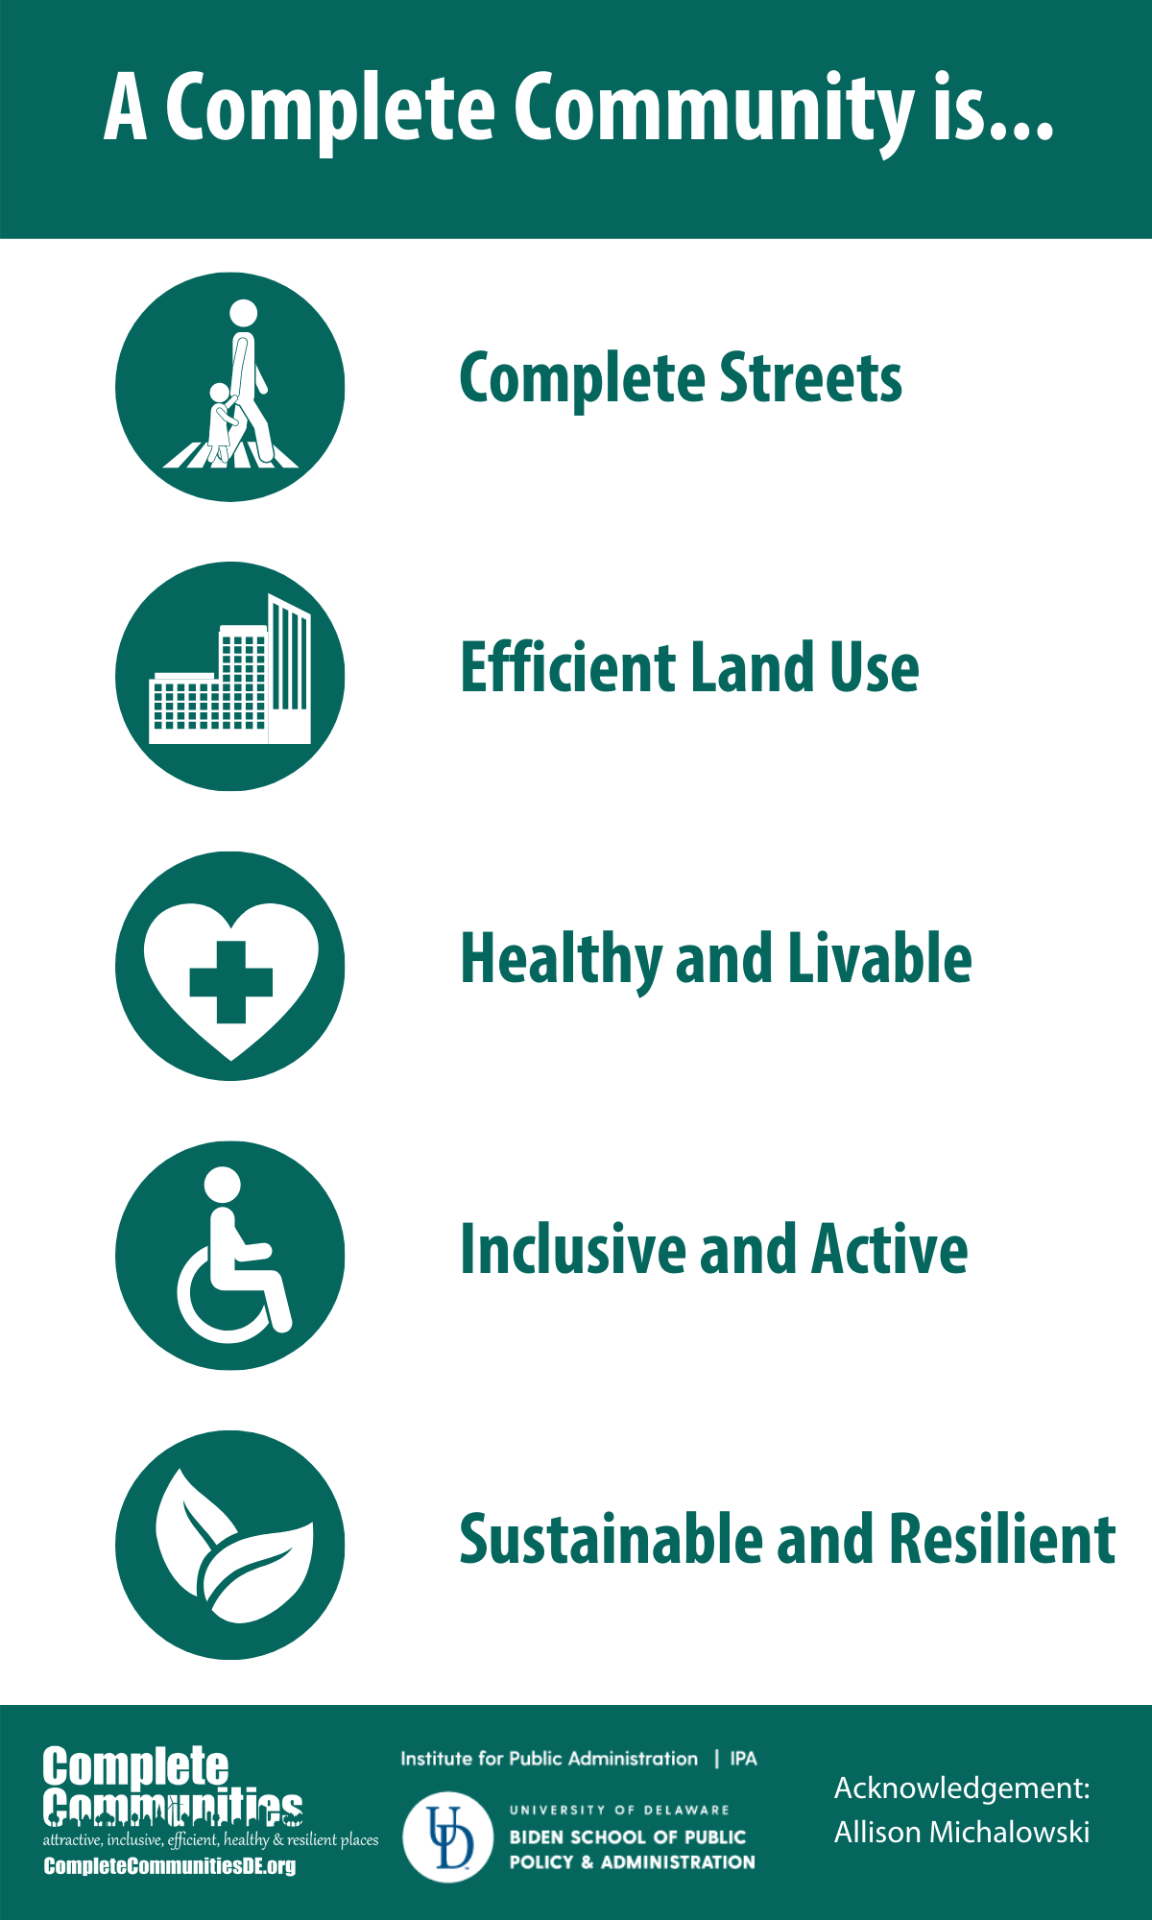
Complete Communities
Complete Streets Crowdsourcing
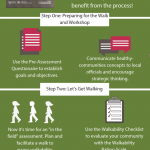
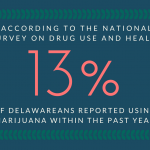
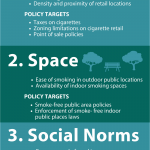
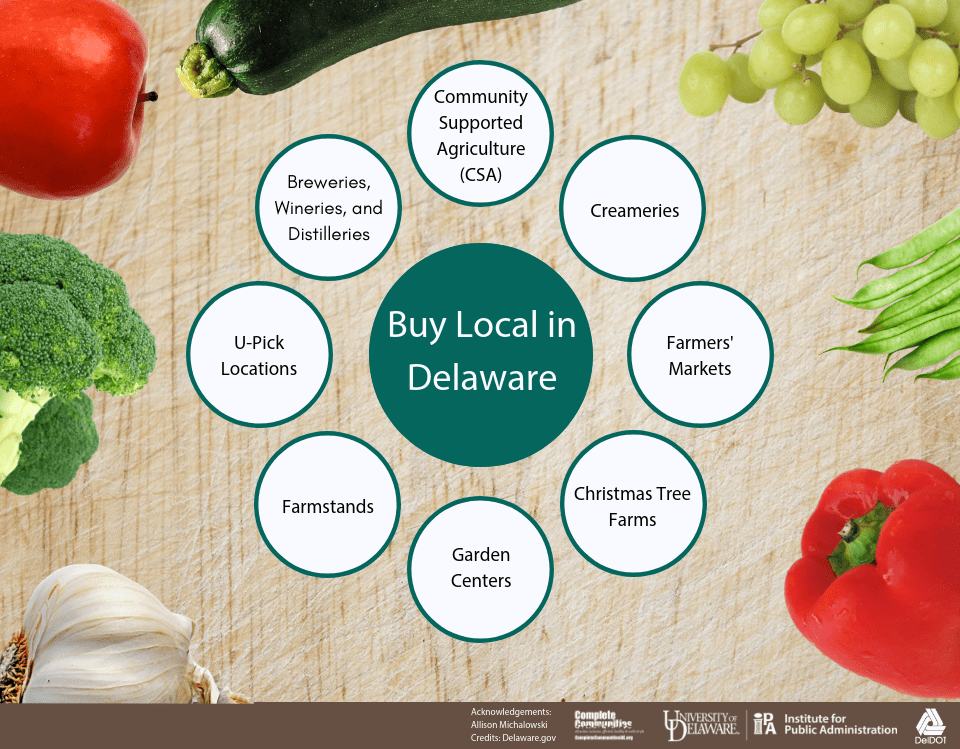
The following infographics were developed as part of a larger project that assessed different strategies for crowdsourcing for active transportation planning in Delaware. The events took place in Newark, Delaware, during Bike Month 2017 and involved several community partners.
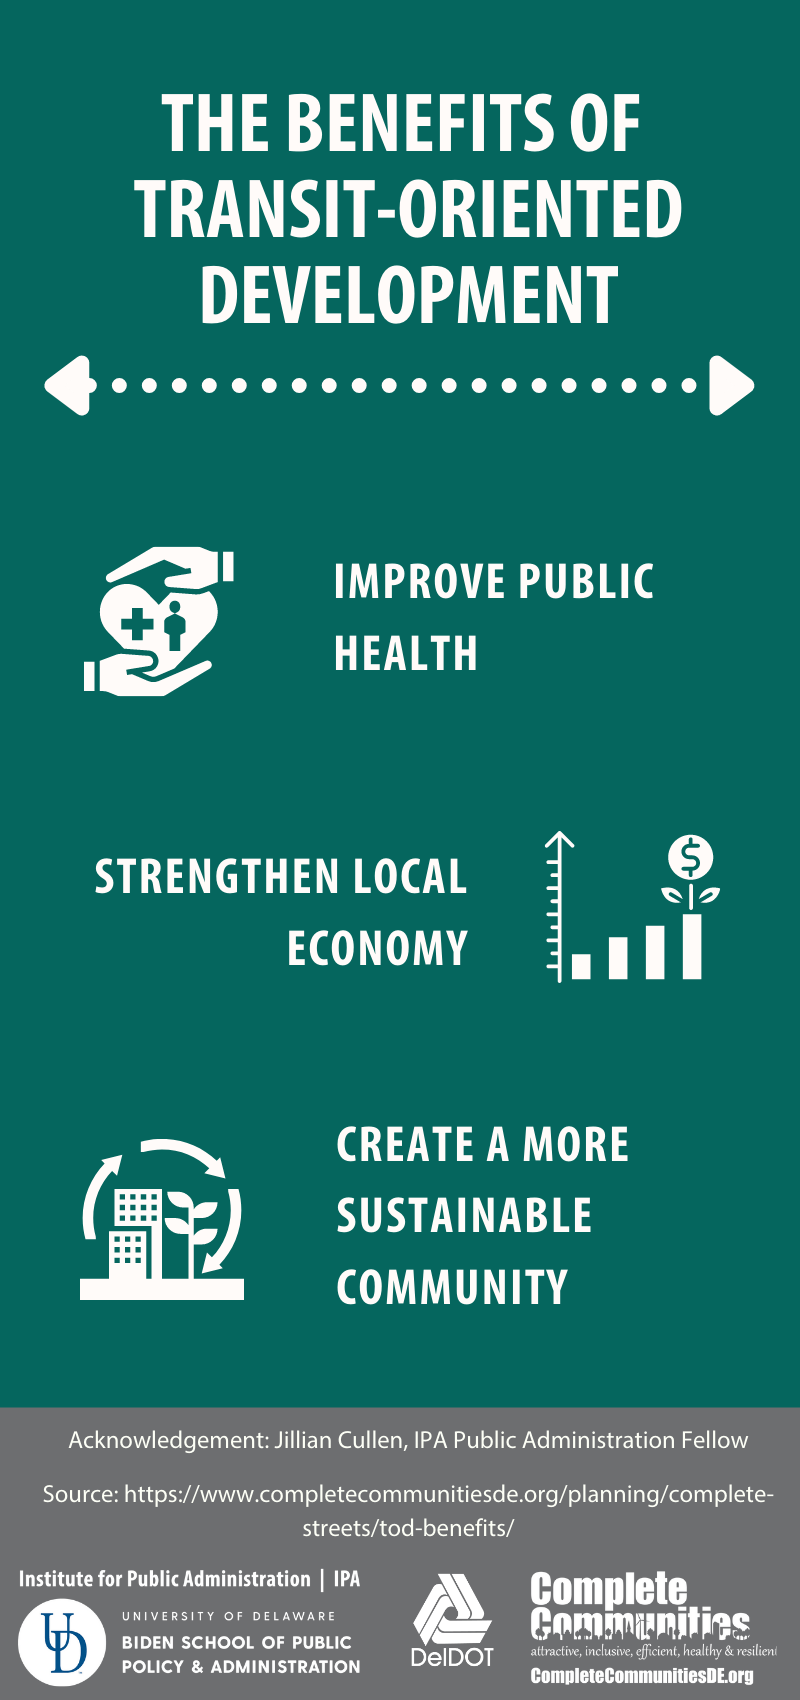
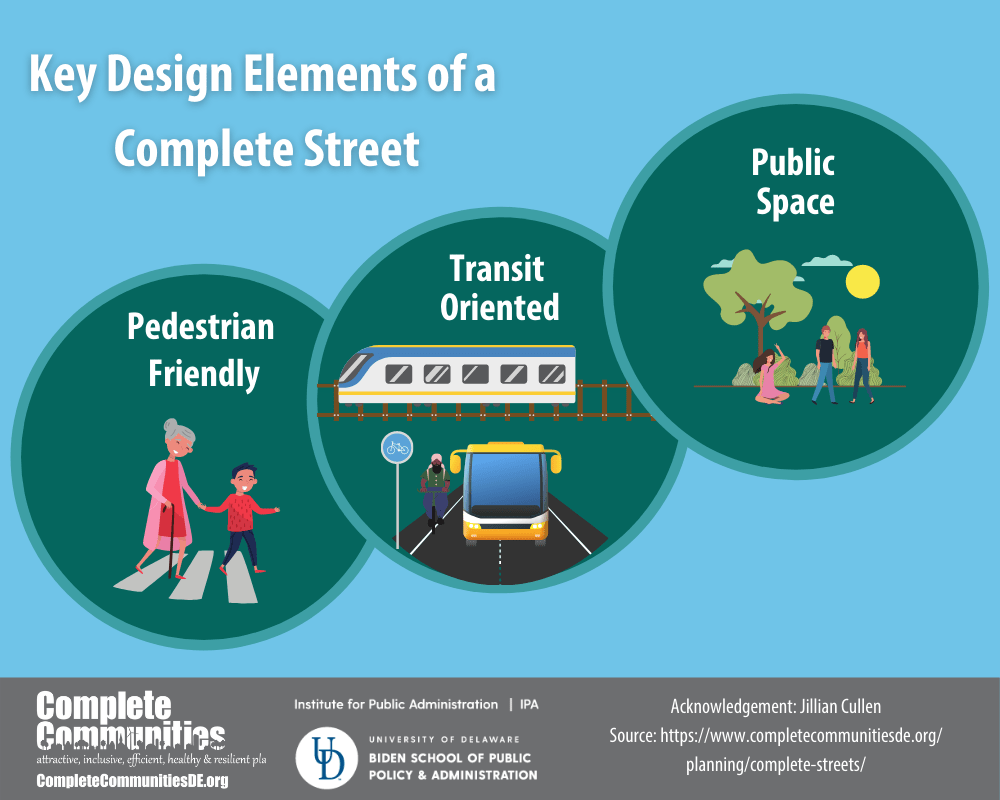
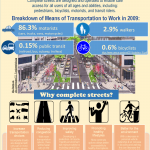
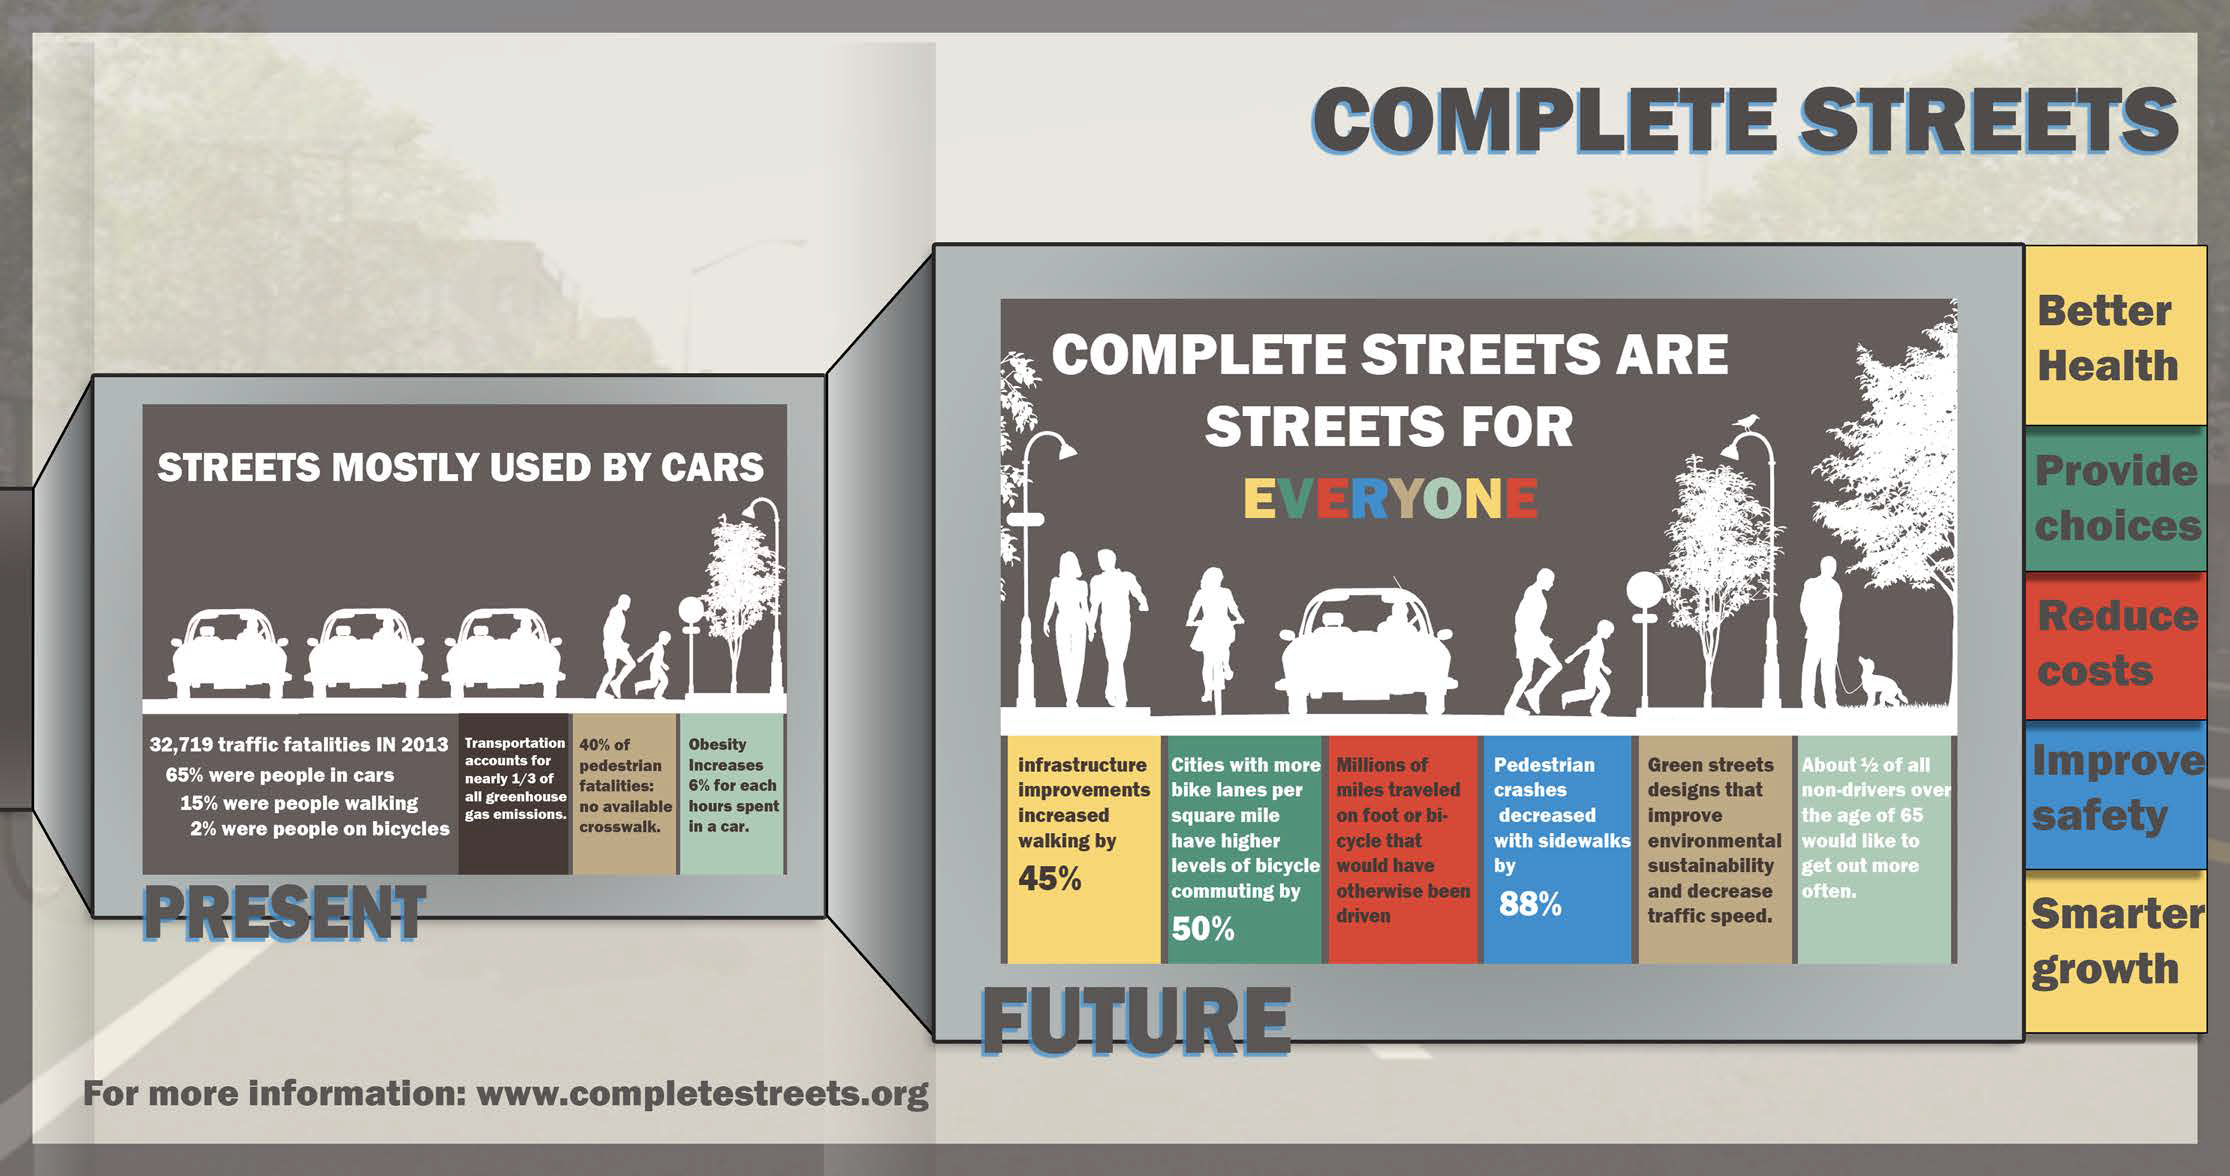
Complete Streets


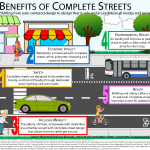
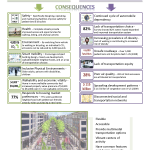
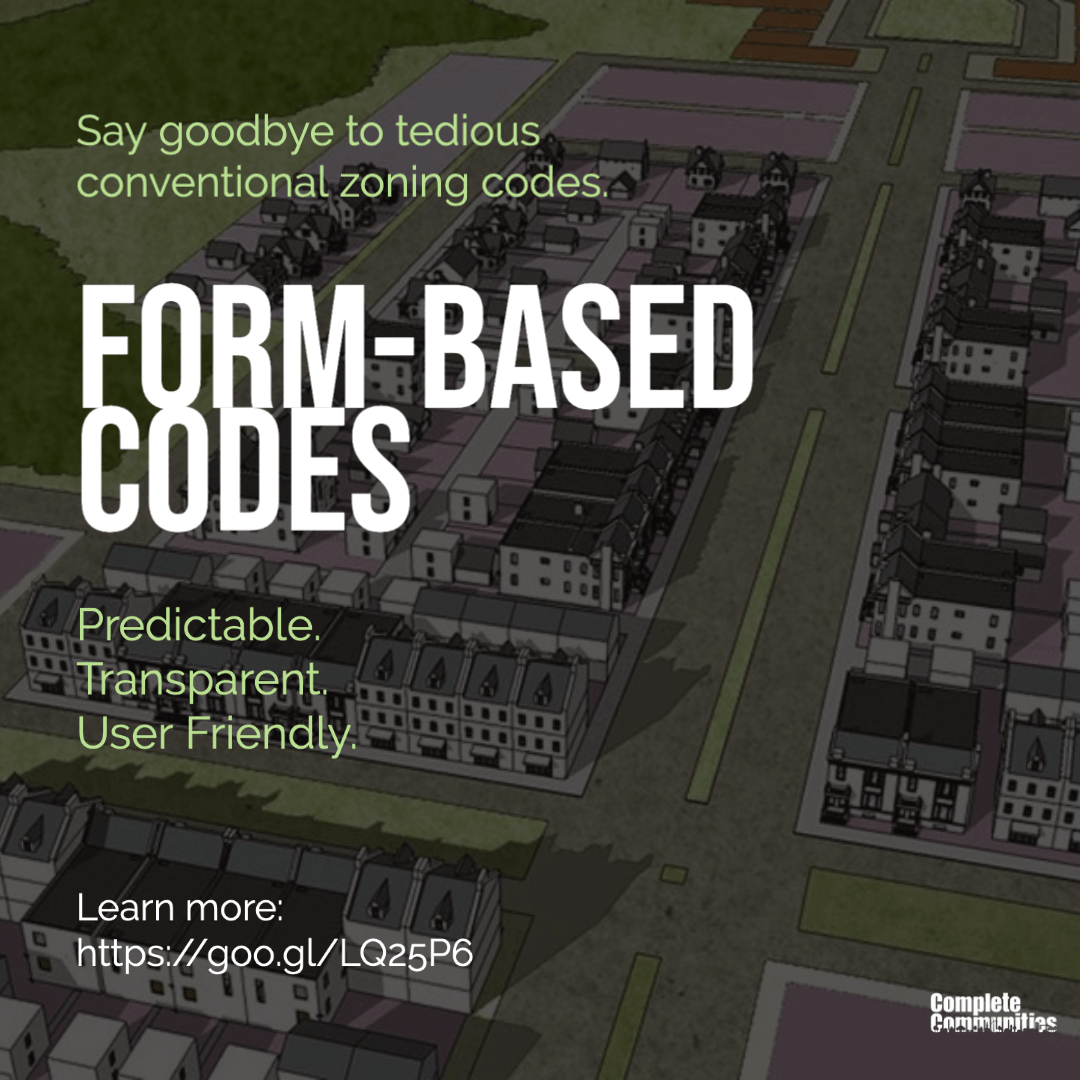
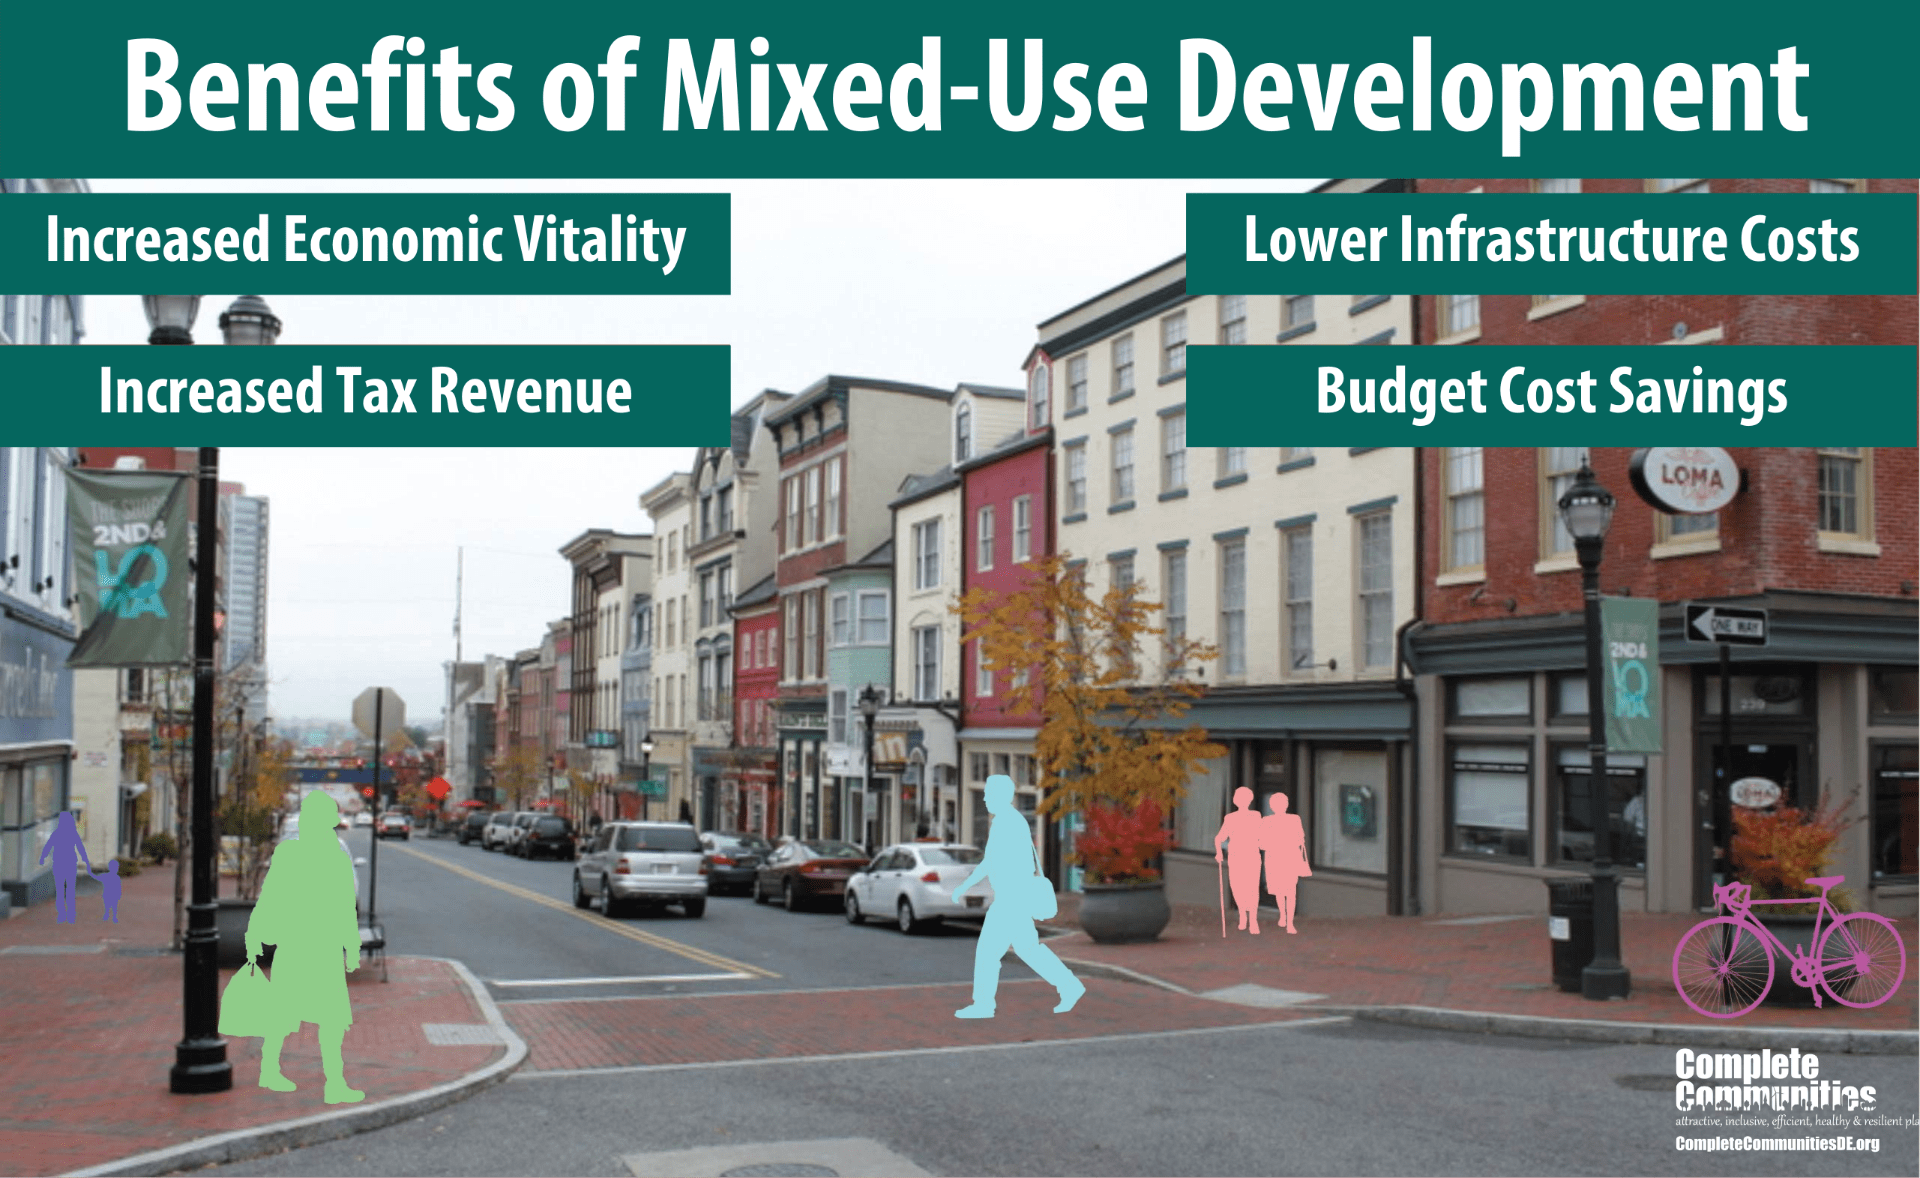
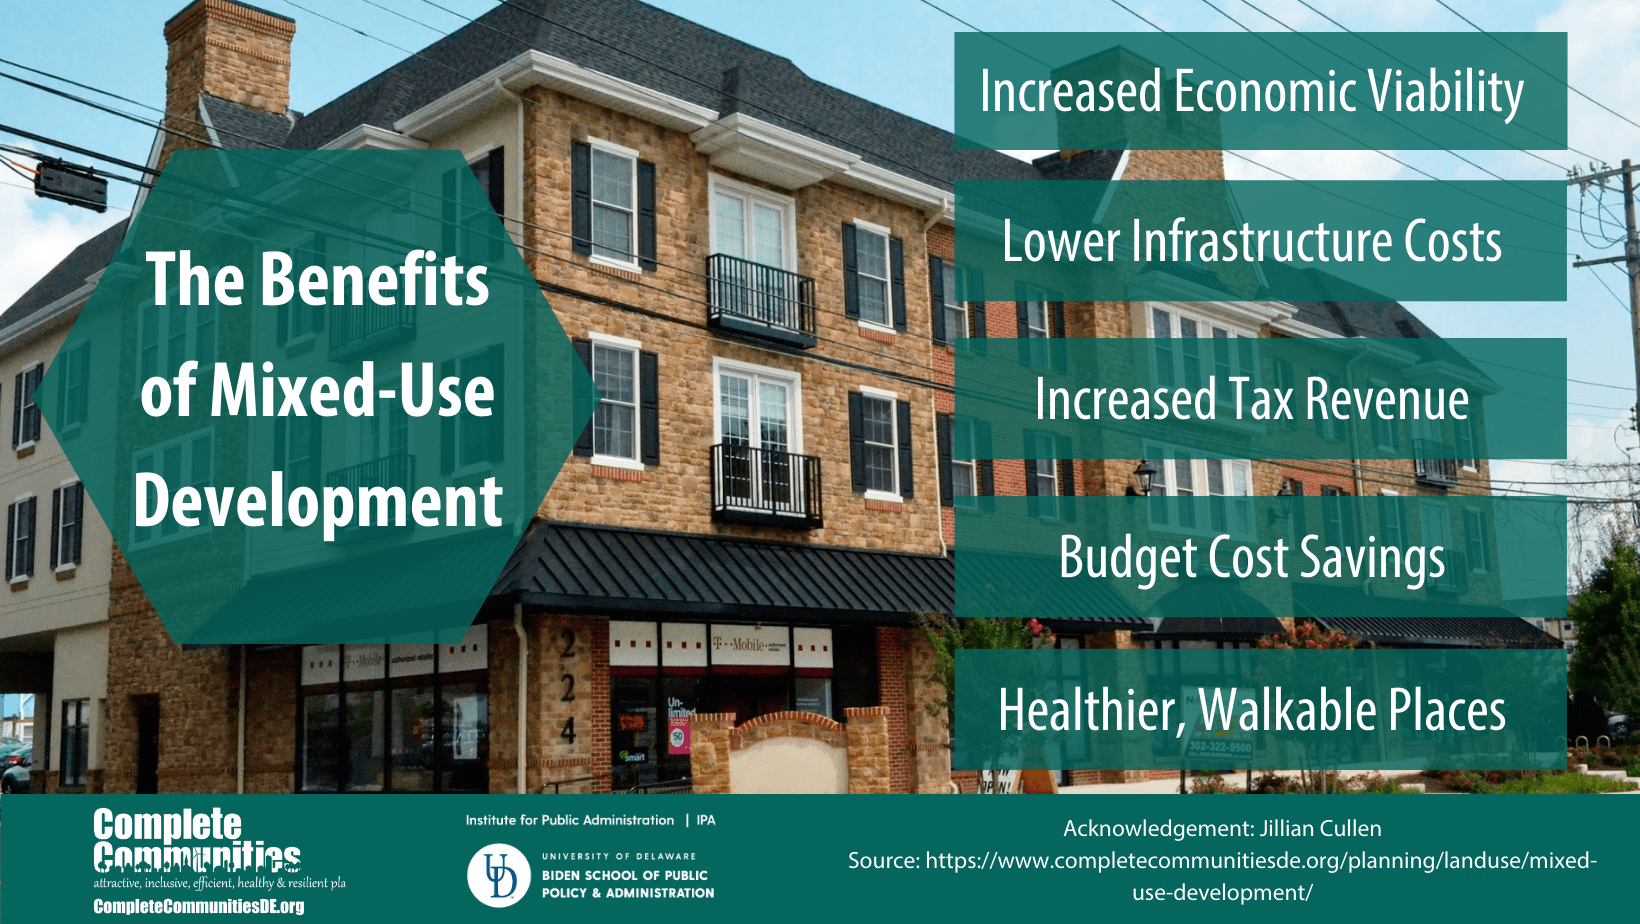
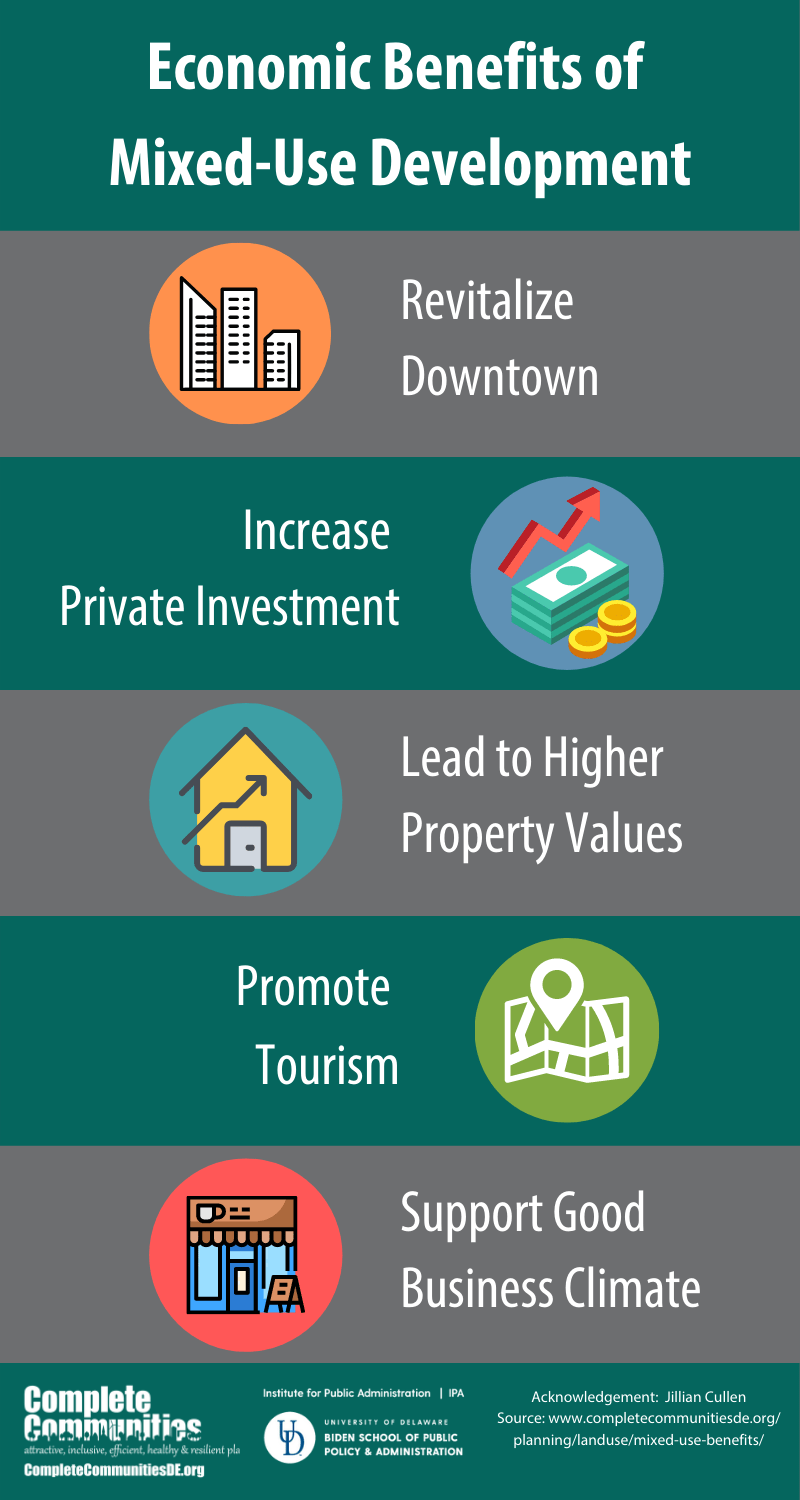
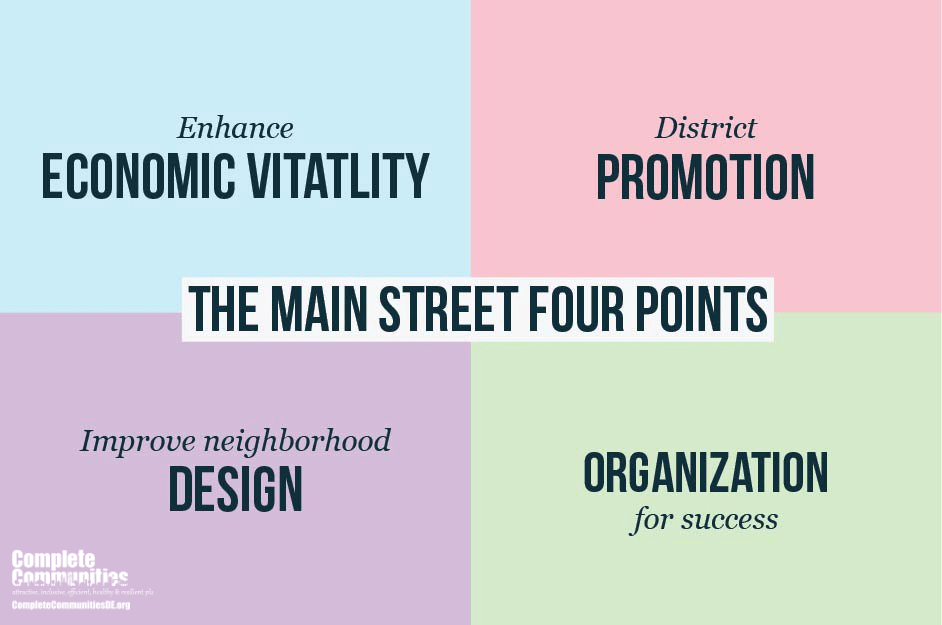
Efficient Land Use

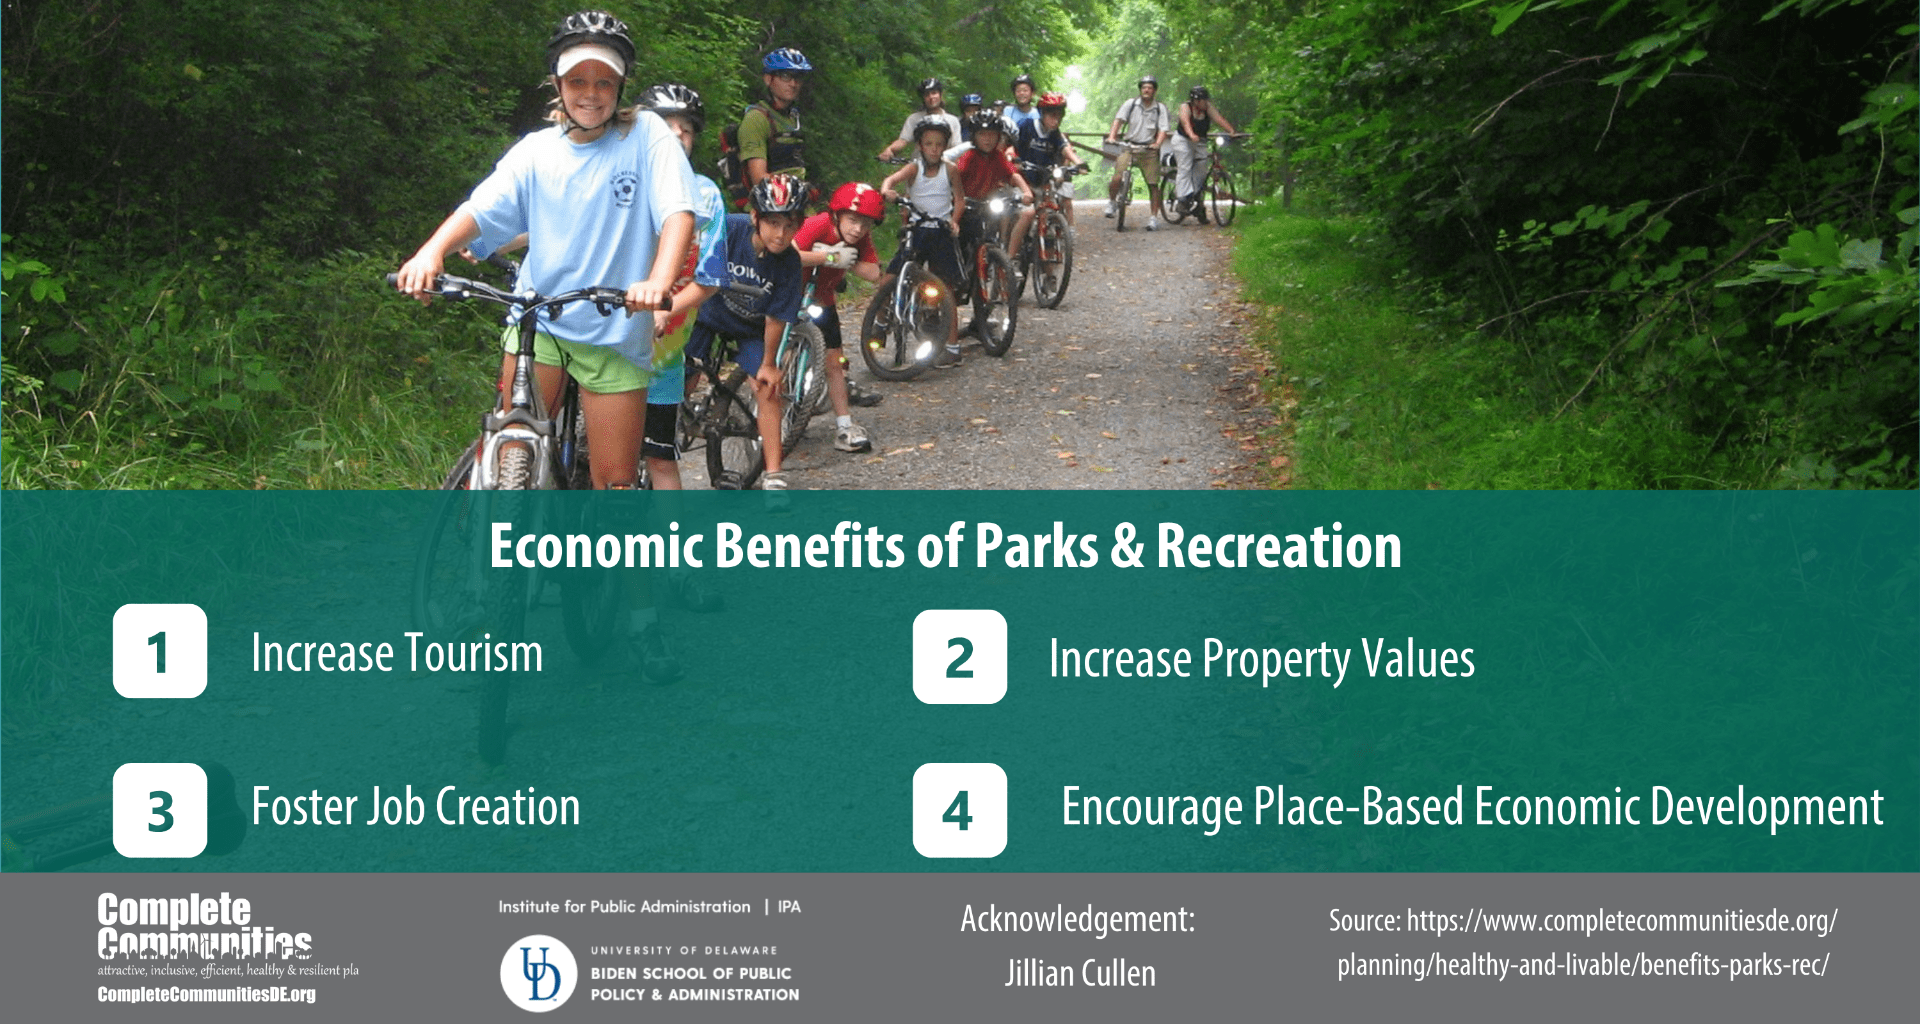
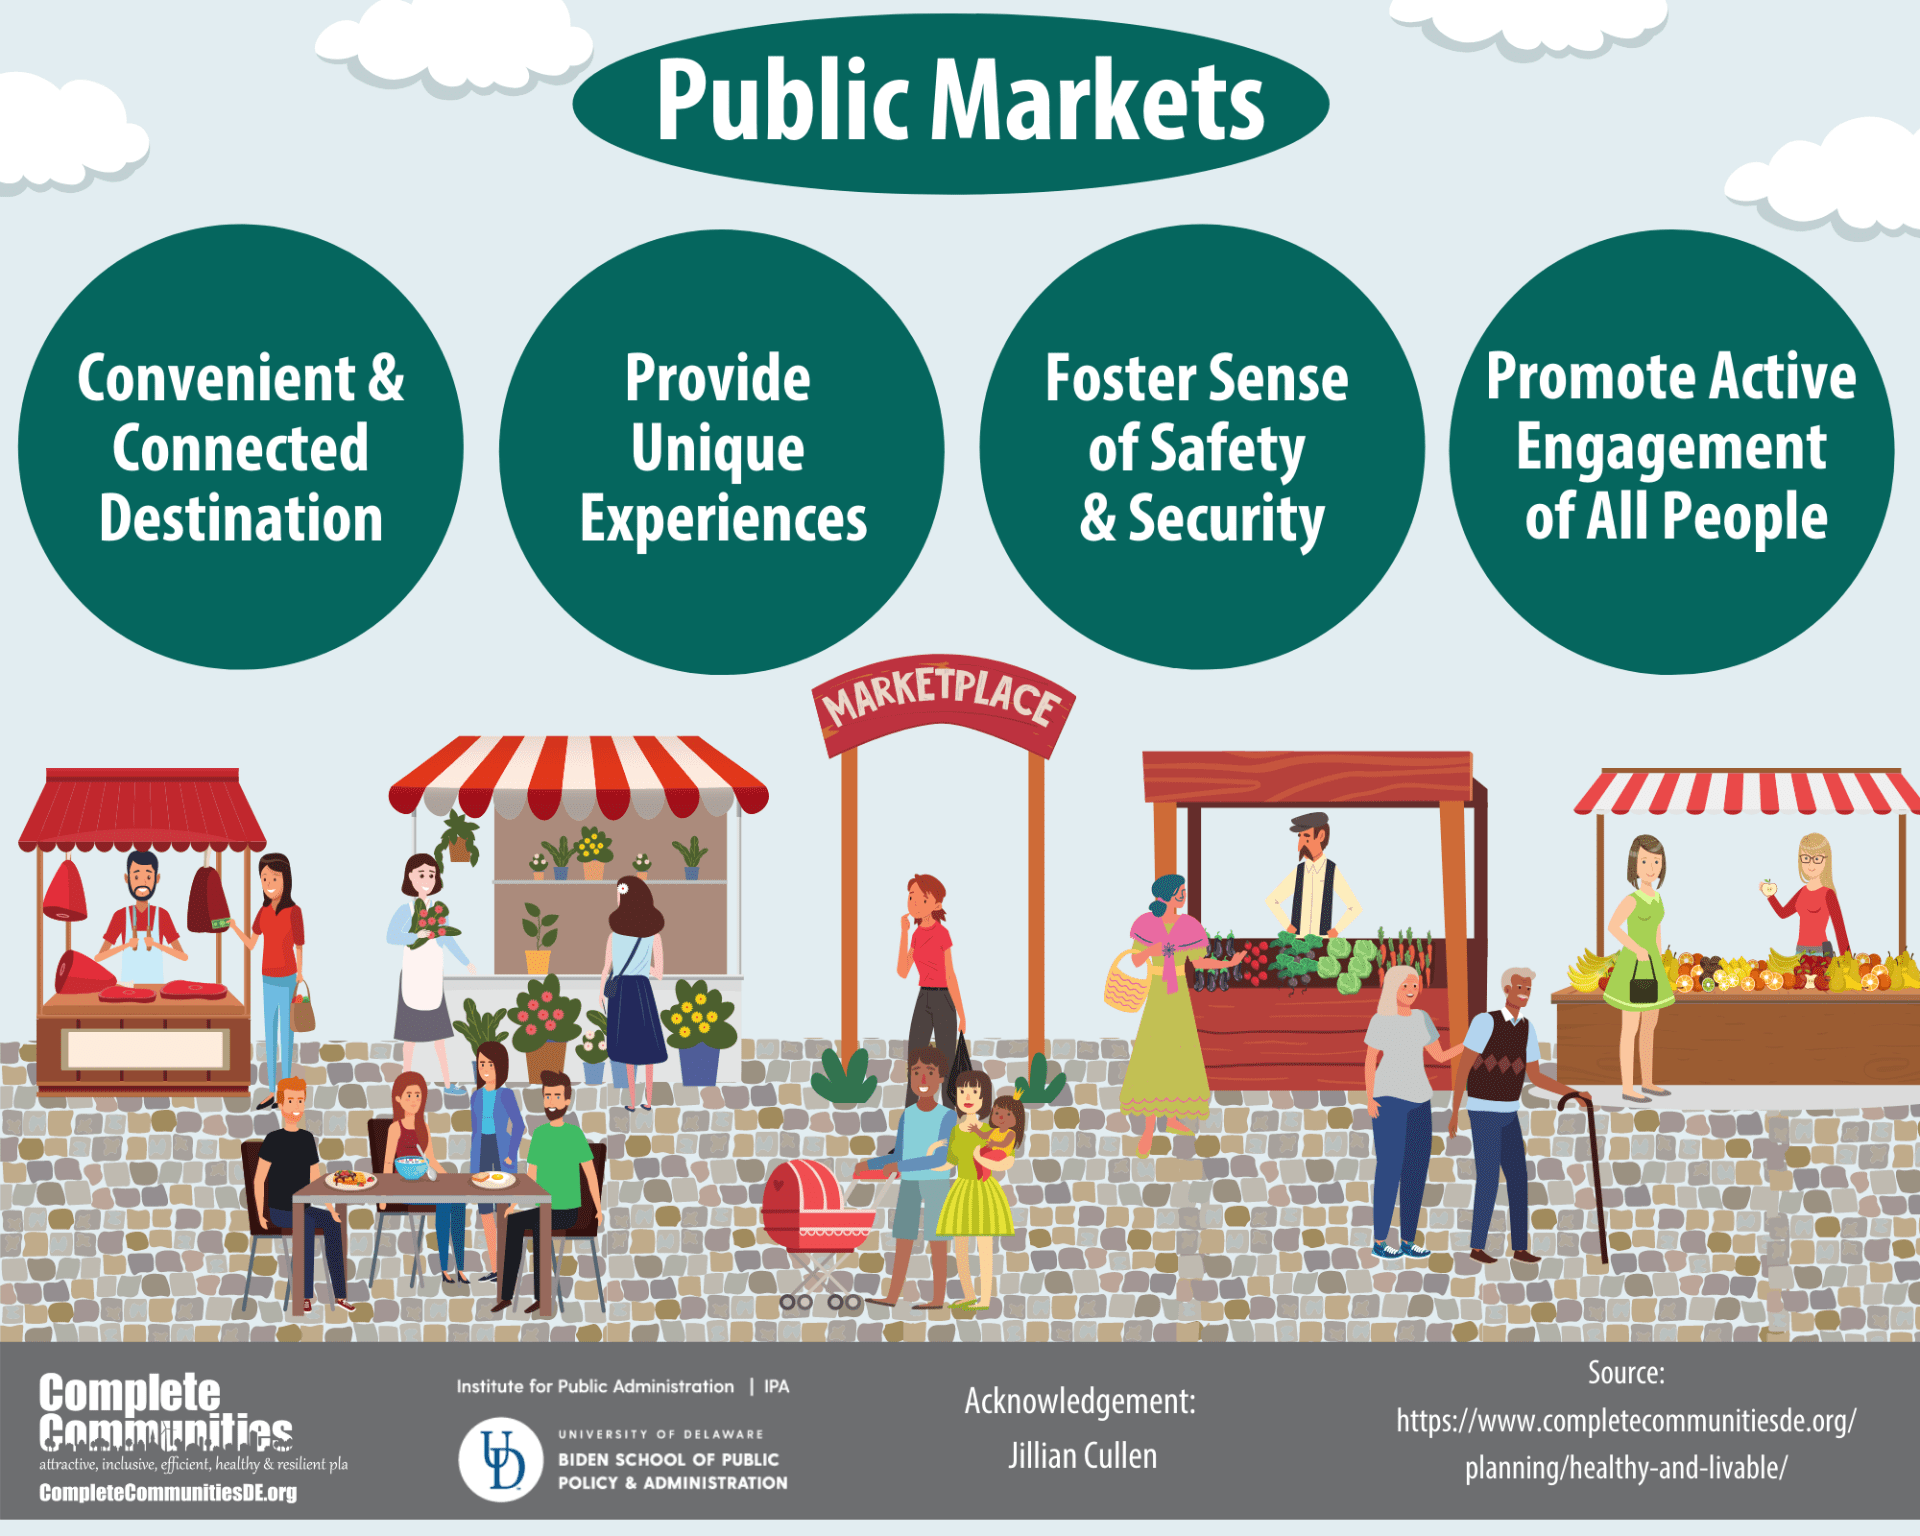
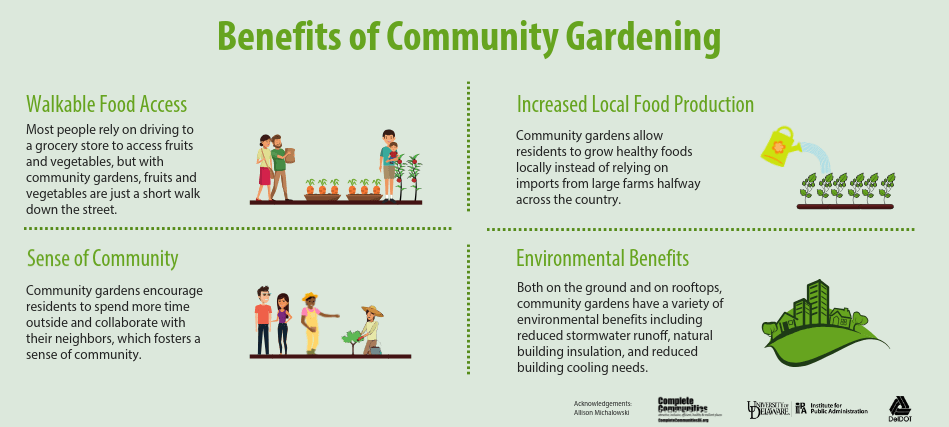
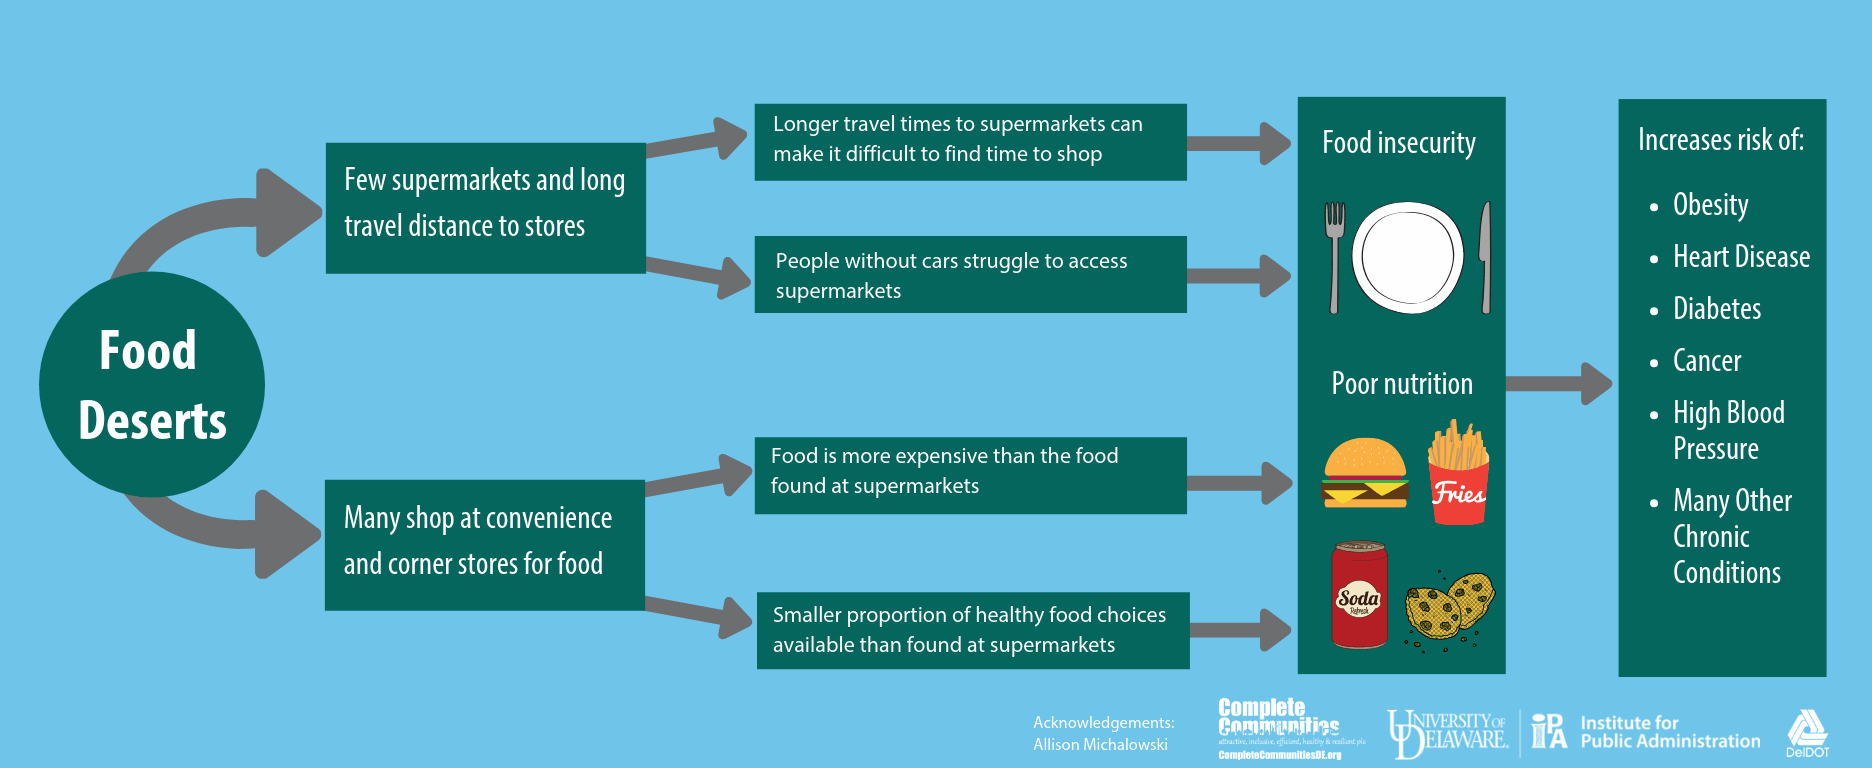
Healthy and Livable


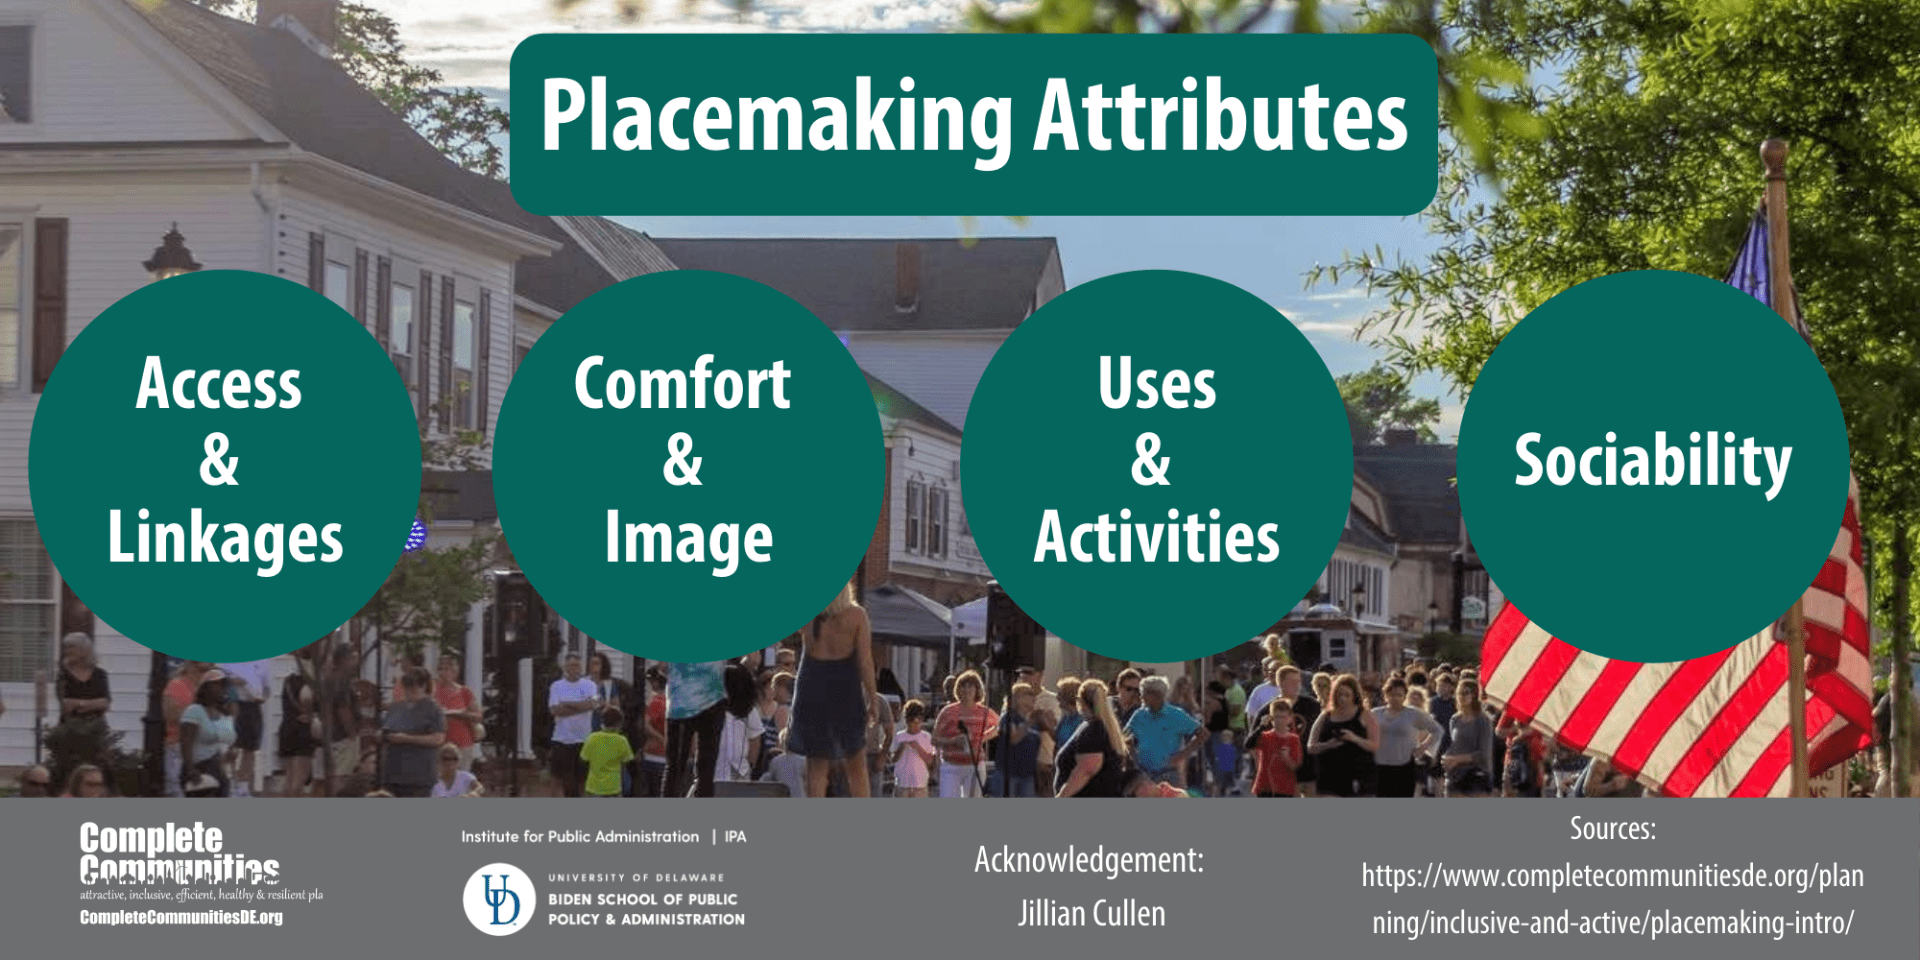
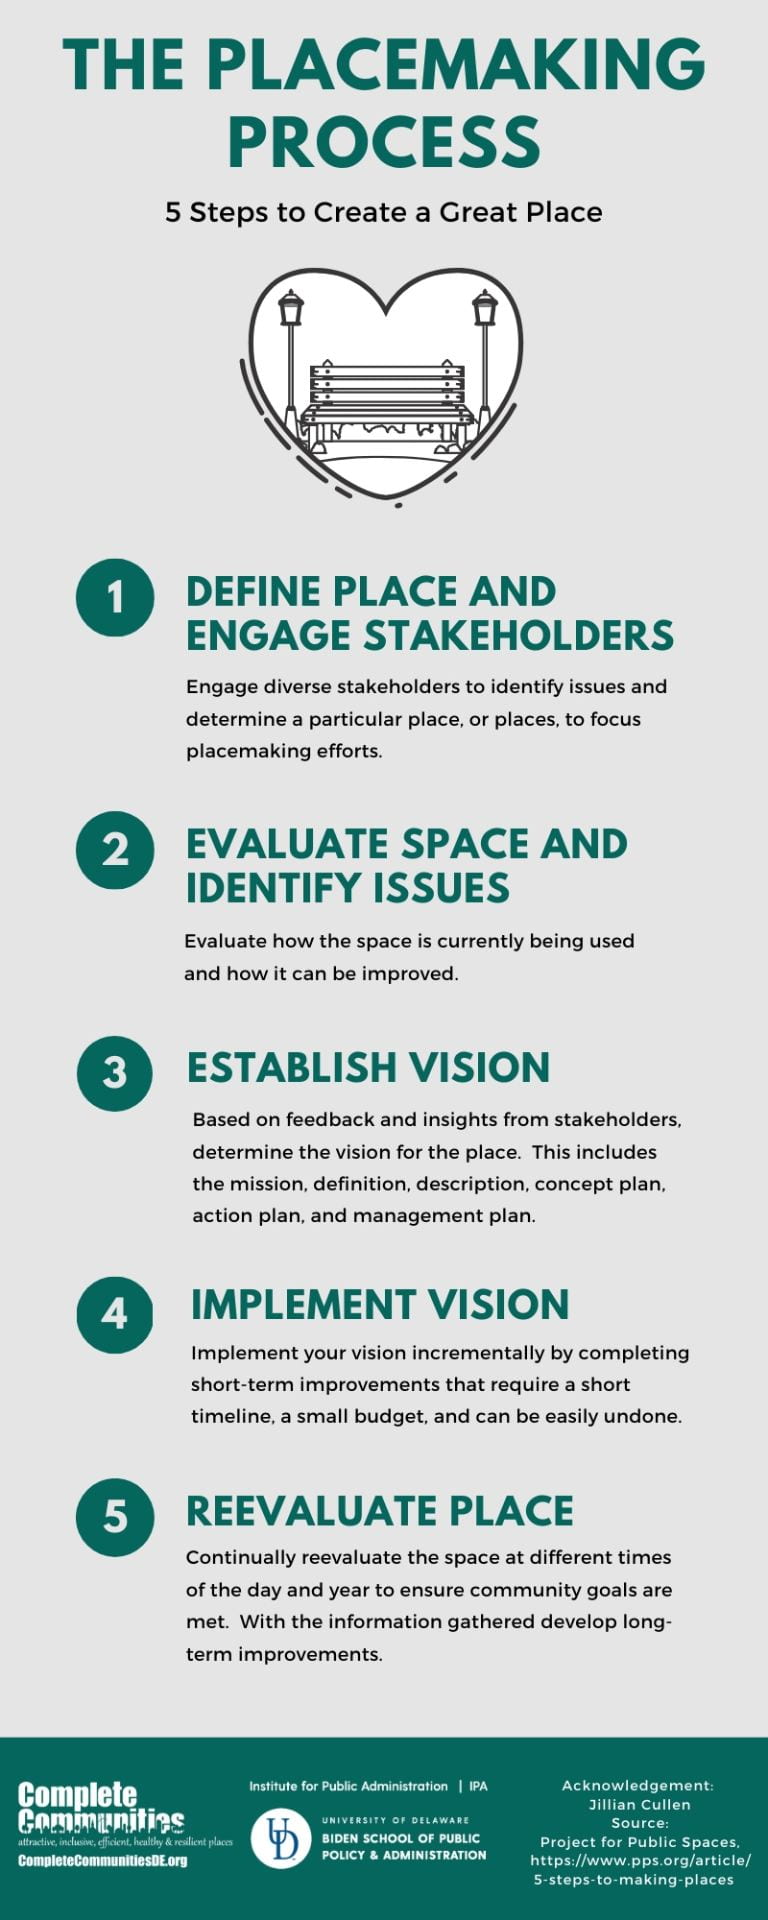
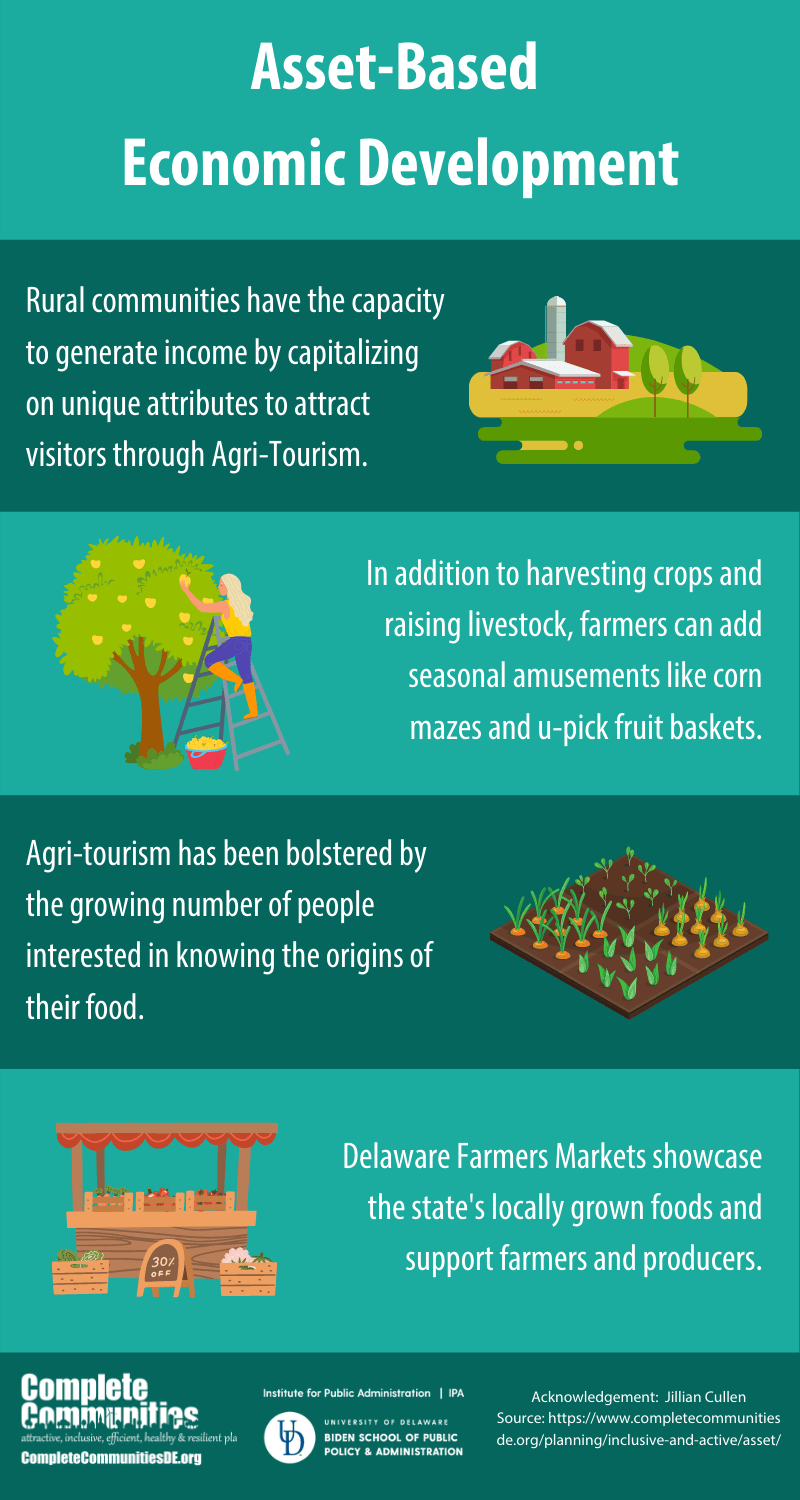
Active and Inclusive

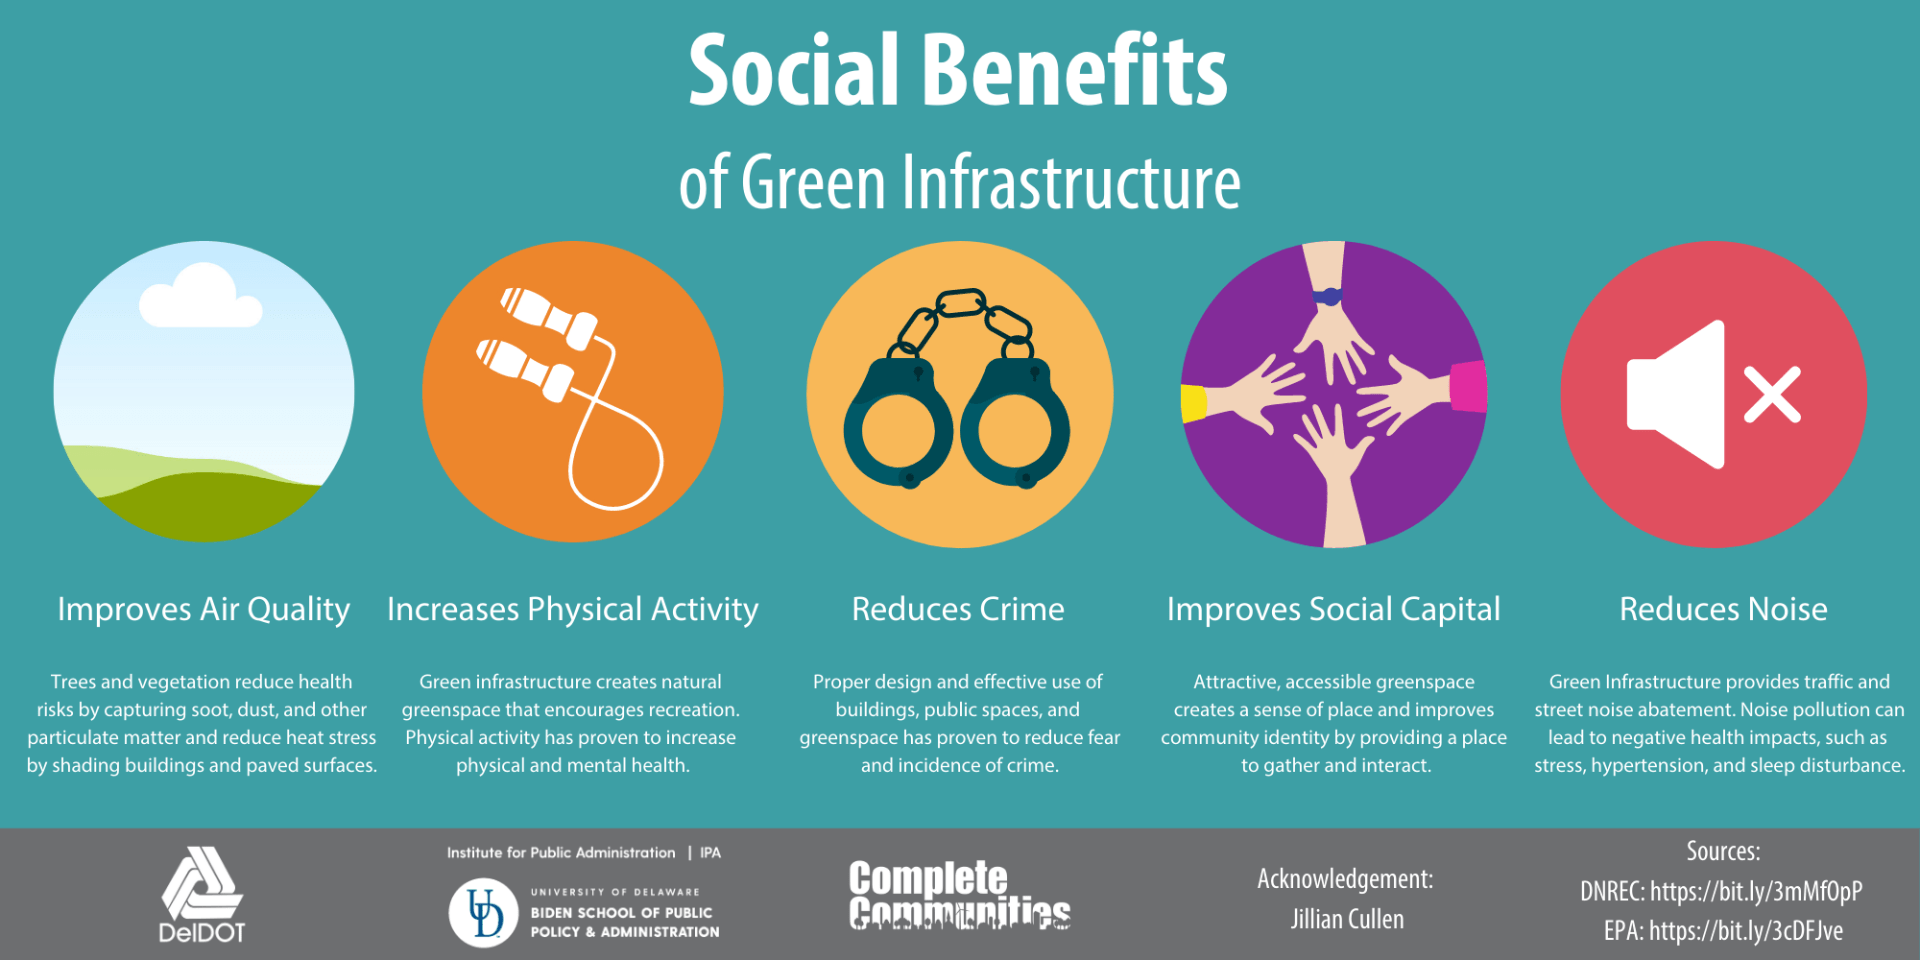
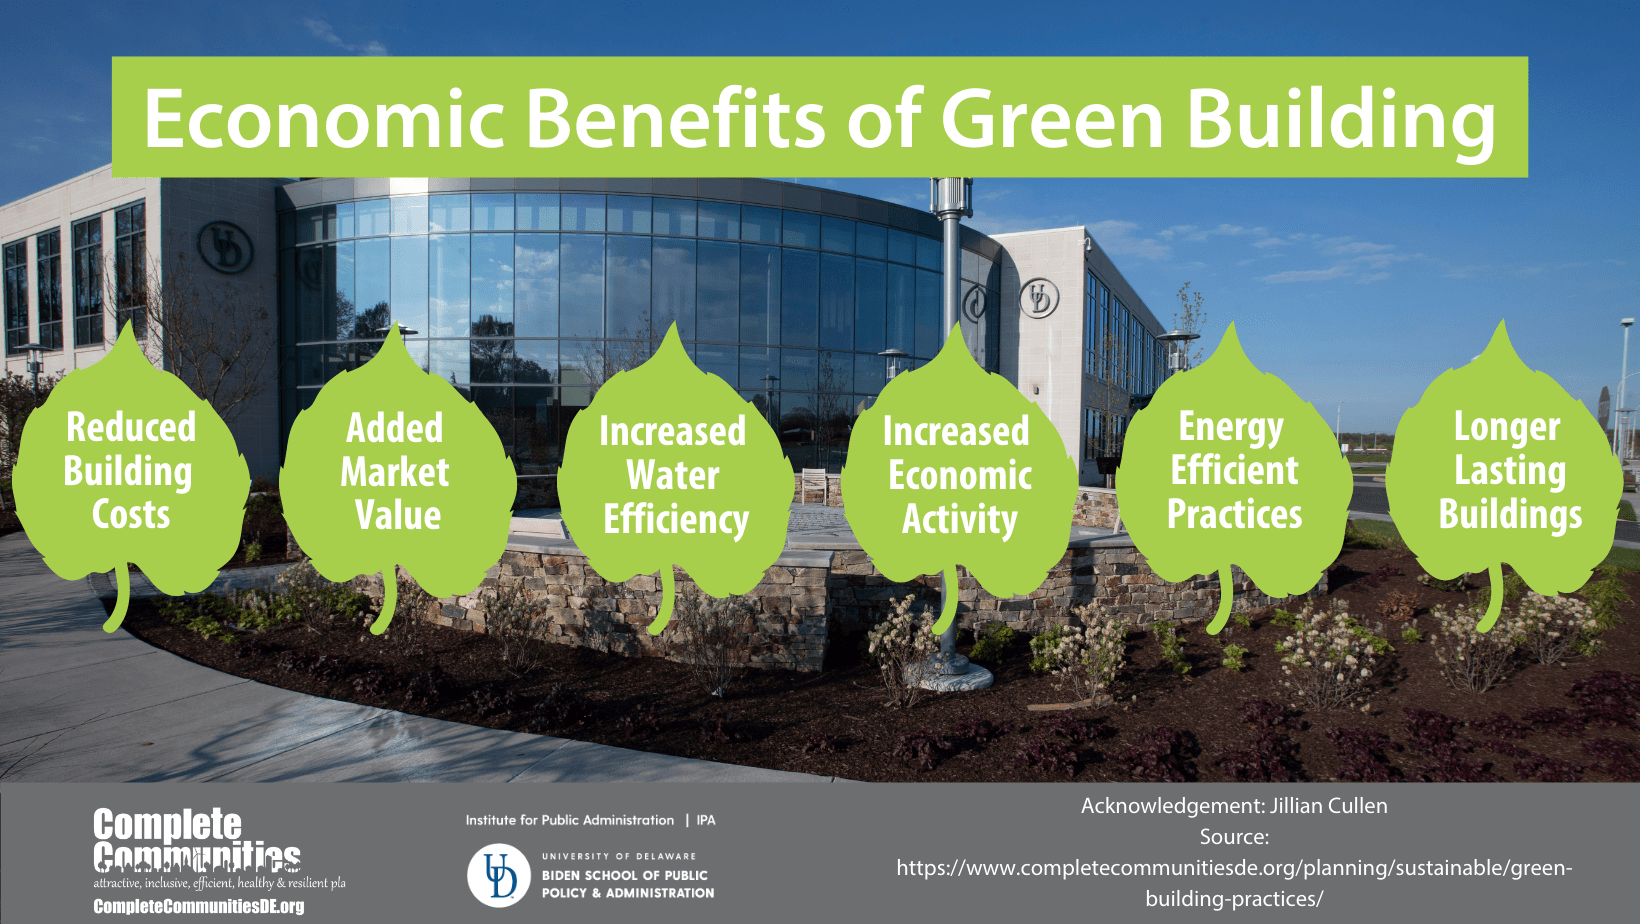
Sustainable and Resilient


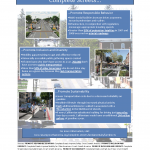
Public Engagement