
What Is a Story Map?
Story maps use Geographic Information System (GIS) tools to combine geospatial data with photos, video, audio, and text to visualize a theme or sequential events. Story maps are designed for nontechnical audiences with access to the Internet; users do not need experience with GIS software to read or use story maps. Story maps serve as a great tool for public engagement because they can easily be shared via social media or embedded within a website.
Using Story Maps to Attract Business Investment
Story maps provide a new avenue for local governments and economic development organizations to showcase a planning process or market features of developable properties. This easy-to-use technology can integrate available, open-access GIS data, such as local infrastructure, like bus routes and cell towers, or Census data on populations and demographics.
Entities interested in boosting economic development could develop story maps to market available properties in downtown “infill” areas, business parks, or other designated growth areas. Maps could also highlight the location of capital improvement projects, must-visit restaurants and breweries, farmers’ market and community garden locations, local park systems, areas of low-impact development and much more.
GIS Story Map Gallery – Implementing Complete Communities in Delaware
The full collection may be viewed on the Implementing Complete Communities in Delaware ESRI GIS Story Map Gallery. GIS story maps, organized by the five elements of a Complete Community may also be viewed individually, as listed below.
Complete Streets
Bicycle Level of Traffic Stress (LTS)
 Low-stress bicycle networks should produce a comfortable experience for bicyclists, of all ages and abilities, through a connected system of low-speed local roads, off-street trails, and on-street bicycle facilities. Bicycle Level of Traffic Stress (LTS) refers to the idea that a set of criteria and measures of low-stress connectivity can be used to evaluate and guide bicycle network planning. The Delaware Department of Transportation (DelDOT) has developed a Bicycle LTS model, available on First Map, the State of Delaware’s GIS portal, to help visualize and plan for a bicycle-friendly Delaware. This GIS Story Map showcases the Bicycle LTS Model, highlights ways to assess bicycle LTS in a community, and can be used as a basis to plan for a bicycle-friendly Delaware.
Context-Sensitive Solutions
 Commonly referred to as CSS, Context-Sensitive Solutions is an approach to tackling transportation projects that seeks to include the unique needs of specific communities. This concept discounts a “one size fits all” design of roads and streets. CSS strives to achieve flexible and creative transportation plans, designs, and programs. This GIS story map uses the tabbed series. policy framework that involves taking the surrounding environmental, physical, and historic characteristics into consideration during project development while integrating the views of stakeholders affected by the project. It provides three best-practice examples of projects that consider the environmental, physical, and historic contexts while integrating views of stakeholders.
Safe Routes to School
 The Safe Routes to School (SRTS) program was developed to help reverse the decline in children walking and biking to school and the associated reduction in their health and safety. Initiatives include infrastructure and non-infrastructure projects that encourage children and their parents to walk and bike to school. Engagement, equity, engineering, encouragement, education, and evaluation are six components of the program. This GIS story map provides insight on the program and how to implement its measures including an overview of projects and a map of current efforts in Delaware.
Tactical Urbanism
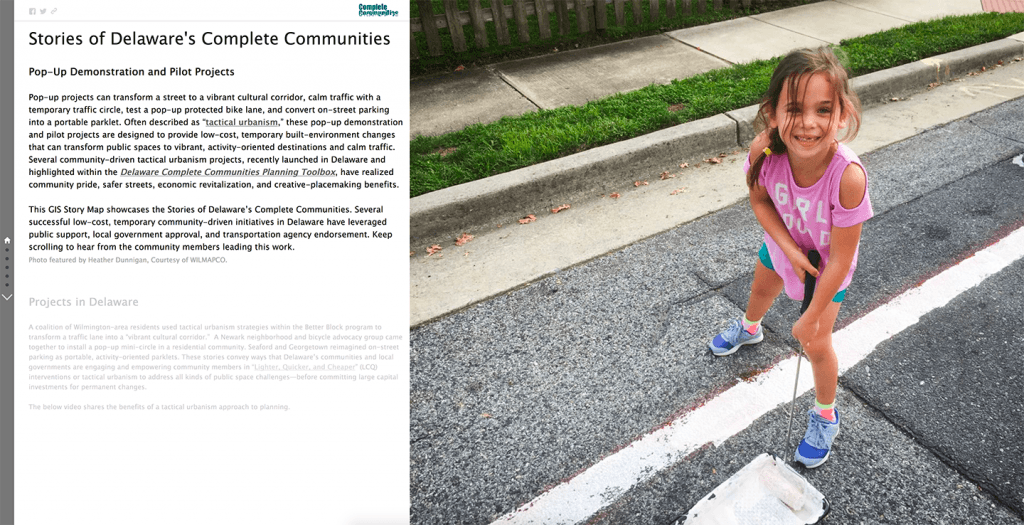 Reconfiguring roadways and public spaces can help calm traffic and achieve more walkable-, bikeable-, and activity-oriented places. But permanent, large-scale changes can be difficult to launch. Often described as “tactical urbanism,” these pop-up demonstration and pilot projects are designed to provide low-cost, temporary built-environment changes that can transform public spaces to vibrant, activity-oriented destinations and calm traffic. View this GIS story map to learn how tactical urbanism in Delaware has been used to test a pop-up bike lane and transform a street to a vibrant cultural corridor, calm traffic with a temporary traffic circle, and convert on-street parking into a portable parklet.
Transportation Alternatives Program
 Delaware’s Transportation Alternatives Program (TAP) encourages and expands the ability to use non-motorized transportation. These efforts can include construction, community improvement activities, recreational trails program, the safe routes to school program and more. This GIS story map includes TAP project eligibility as well as information about applying for the Delaware TAP.
Visualizing Complete Streets
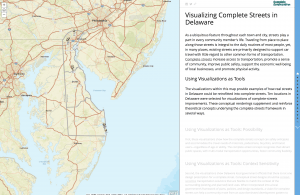 Ten locations in Delaware were selected for developing visualizations of complete-streets improvements. Each before-and-after scenario is a conceptual rendering, which is based on an original photograph of the location and is not an actual “engineered” design. SketchUp 3D-modeling software was used to explore complete-streets design options for nine out of the ten locations. View this GIS story map to see how real streets in Delaware could be retrofitted into complete streets. Depending on the roadway and land-use context, features may include sidewalks, bike lanes, accessible transit stops, enhance crosswalks, curb improvements, traffic-calming measures, and/or streetscaping amenities.
Efficient Land Use
Mixed-Use Development
 Mixed-use development is characterized as pedestrian-friendly development that blends two or more residential, commercial, cultural, institutional, and/or industrial uses. Mixed use is one of the ten principles of Smart Growth, a planning strategy that seeks to foster community design and development that serves the economy, community, public health, and the environment. This GIS story map uses the swipe and spyglass templates to explain benefits of mixed-use development and illustrate six best-practice examples of how the concept is being implemented to achieve efficient land use in Delaware.
Healthy and Livable
Aging-Friendly Environments
 Planning for “aging-friendly” communities is one component of building a healthy and livable community. Aging-friendly communities are communities that provide affordable, accessible housing, multiple modes of transportation, access to community services, and community engagement opportunities for older adults. This GIS story map harnesses U.S. Census data to show locations of where older adults are residing in Delaware. Using the tabbed GIS story maps series, it illustrates where aging-friendly strategies like the Village Model is occurring in Delaware and communities that have adopted Accessory Dwelling Unit (ADU) regulations to support aging in community.
Inclusive and Active
Newark Public Art
 This interactive Newark Public Art GIS Story Map was created using data generated from a crowdsourced, web-based survey app. It enables residents, visitors, and the UD community to virtually discover the murals, sculptures, paintings, and other art that commemorate UD’s and Newark’s heritage and cultural roots.
Historic Preservation
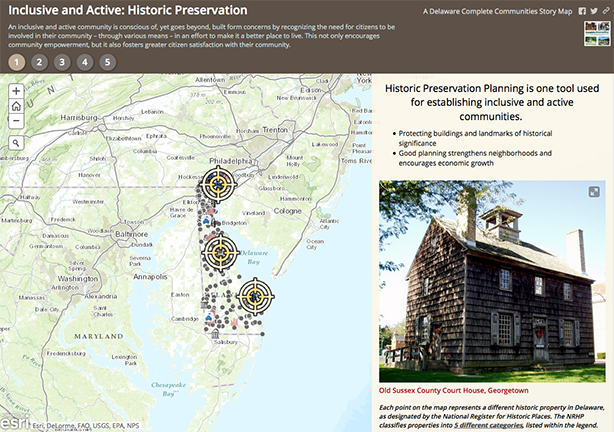 As defined by the National Trust for Historic Preservation, historic preservation is identifying, protecting, and enhancing buildings, places, and objects of historical and cultural significance. This GIS story map uses the bulleted series to pinpoint locations of historic properties, landmarks, and districts in Delaware, as designated by the National Register for Historic Places. Three Delaware best practice examples of regulatory tools, historic renovation, and revitalization initiatives are provided.
Scenic Tour of Delaware Byways Showcase
 The Scenic Tour of Delaware Byways Showcase is a cascade-style GIS Story Map. Scroll down for information about the Delaware Byways program and view the embedded GIS Story Maps that provide virtual tours of each of the six byways in Delaware.
Sustainable and Resilient
Green Infrastructure Projects in Delaware
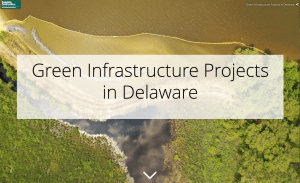 Green infrastructure describes an array of practices that use or mimic natural systems to reduce and treat stormwater at its source while delivering environmental, social, and economic benefits. The Green Infrastructure Projects in Delaware GIS Storymap showcases cost-effective, resilient, nature-based approaches that are helping to address environmental and climate-change challenges in Delaware.
Investments in Downtown Development Districts
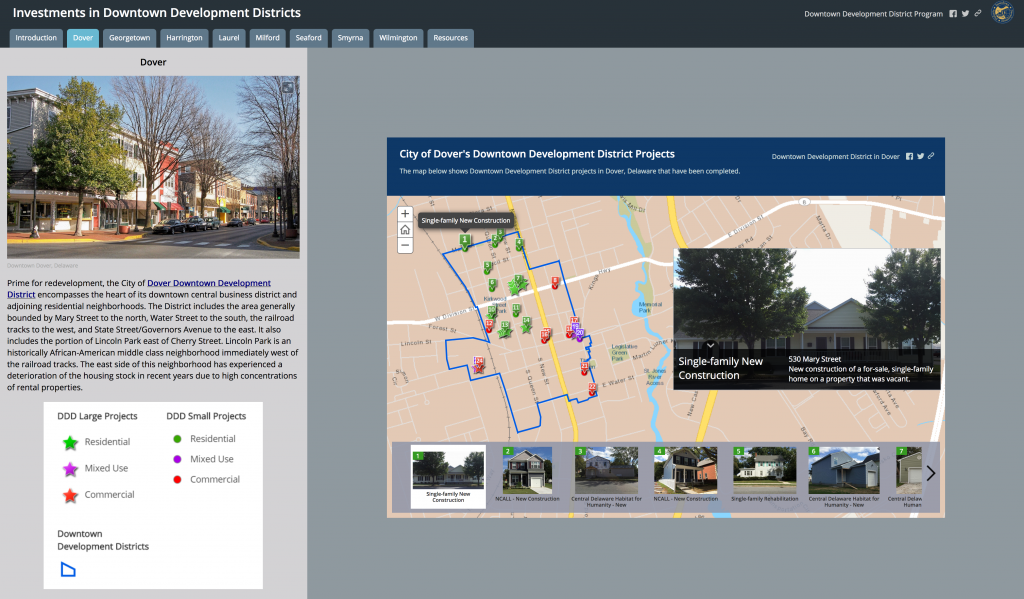 The “Investments in Downtown Development Districts” (DDD) GIS story map embeds the GIS story maps for each DDD jurisdiction in Delaware. The story maps highlight developer investments for both large and small project set-asides in each community. In addition, the maps identify the type of project in terms of commercial, residential, and/or mixed-use development. View each DDD GIS story map on IPA’s “Implementing Complete Communities in Delaware” gallery.
Flood Ready Communities: Freeboard
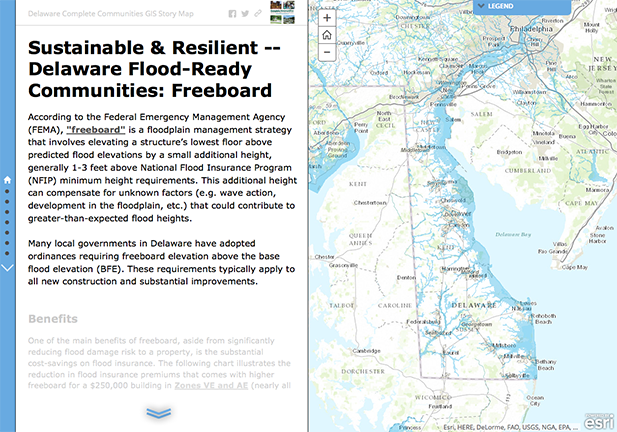 This GIS story map showcases “freeboard” as a tool to achieve a Sustainable and Resilient community. When adopted as part of a floodplain management strategy, freeboard can create Flood-Ready Communities that are prepared to protect and preserve properties and lives. This story map features Delaware’s guidelines for freeboarding and provides visual examples.
Town of Middletown: Setting the Stage for Economic Growth
 This story map displays the visioning and planning process for the Amazon Fulfillment Center Project in Middletown, Delaware. This project is a success story of how a Delaware municipality used its comprehensive plan as a foundation to develop the Westown Master Plan, which set the stage for “market ready” development and economic growth. The story map used New Castle County’s mapping service to provide an infrastructure base map.
City of Dover: Using Story Maps to Promote Sale of Vacant Properties
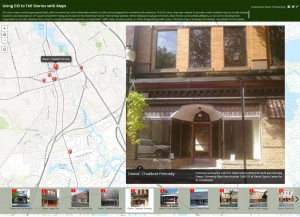 Prepared for the City of Dover, this GIS story map, provides a visual display of locations, photographs, and descriptions of “vacant properties” being promoted on the Downtown Dover Partnership website. The base map shows USA Median Household Income levels; the darker blue areas show income greater than $82,000 ranging down to the lighter pink areas, which show incomes less than or equal to $24,000.
Reimagine Laurel GIS Story Map
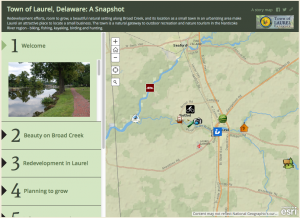 This GIS story map was developed for the Town of Laurel to highlight its outstanding redevelopment potential, location for small businesses, and quality of life. The GIS story map offers a variety of demographic and marketing data, points of interest, marketing research, and information about infrastructure and rates. The story map is a project of the Sussex County Economic Development Action Committee (SEDAC), funded by the University of Delaware’s Sustainable Coastal Communities program. The maps and data are easy to upgrade and link to or embed on a town’s website.
The map series was constructed by Nicole Minni, GISP, of the University of Delaware IPA and Lee Ann Walling, AICP, of Cedar Creek Sustainable Planners.
Creating a Story Map
Story maps are created using Esri’s ArcGIS software. Visit Esri’s website to create a Public Account for ArcGIS Online. This video tutorial guides users through the steps to create a story map. Visit the gallery to see how other organizations have used story maps.
Assistance with Developing a Story Map
Contact IPA’s GIS Specialist Nicole Minni, at nminni@udel.edu, to obtain information on contracting her services to develop story maps.